Sasmirala Individual Information for NGC 5643
Description
NGC 5643 is a face-on barred spiral galaxy at a distance of D = 16.9 ± 3.4 Mpc [tully_nearby_1988] with a Sy 2 nucleus [veron-cetty_catalogue_2010]. It features a compact radio core with two-sided, kiloparsec-scale lobes in east-west direction (PA~ 87∘; [morris_velocity_1985, leipski_radio_2006]) and a cospatial one-sided, kiloparsec-scale NLR cone (PA~ 84∘; e.g. [simpson_one-sided_1997]). In addition, water maser emission was detected in NGC 5643 [greenhill_discovery_2003]. The first ground-based MIR observations of NGC 5643 were performed by [roche_atlas_1991], while first arcsecond-resolution N-band data obtained with ESO 3.6 m/TIMMI2 were presented in [siebenmorgen_mid-infrared_2004]. NGC 5643 was also observed with ISO [rigopoulou_large_1999, siebenmorgen_mid-infrared_2004] and Spitzer/IRAC, IRS and MIPS. The corresponding IRAC and MIPS images show a compact MIR nucleus embedded within the spiral-like host emission. The IRS LR staring-mode spectrum exhibits silicate 10 μm absorption, prominent PAH emission, and a steep red spectral slope in νFν-space (see also [shi_9.7_2006, goulding_towards_2009]). Thus, the arcsecond-scale MIR SED is significantly affected by star formation. We observed the nuclear region of NGC 5643 with VISIR in 2009 and obtained three narrow N-band images and a LR N-band spectrum [honig_dusty_2010-1]. In addition, a T-ReCS LR N-band spectrum is presented in [gonzalez-martin_dust_2013]. All three VISIR images show a compact nucleus as well as additional emission from the host. The nucleus appears elongated with a PA~ 50∘ (FWHM(major axis)~ 0.43arcsec ~ 43 pc). However, at least a second epoch of subarcsecond MIR imaging is required to confirm this extension. Our remeasured nuclear ARIII and PAH2_2 fluxes are unchanged with respect to [honig_dusty_2010-1]. The nuclear photometry and spectroscopy is in general consistent, except for the shortest wavelengths where deviations occur. The resulting nuclear MIR SED has on average ~ 34% lower flux levels than the Spitzer spectrophotometry and exhibits much weaker PAH emission. Therefore, we attribute the flux difference to circum-nuclear star formation as already demonstrated in [honig_dusty_2010-1]. The silicate 10 μm absorption feature possesses the same depth at both spatial scales, which we intrepret as generic to the (projected) central ~ 35 pc of NGC 5643.
- [gonzalez-martin_dust_2013] O. González-Martín, J. M. Rodríguez-Espinosa, T. Díaz-Santos, C. Packham, A. Alonso-Herrero, P. Esquej, C. Ramos Almeida, R. Mason, and C. Telesco. Dust in active galactic nuclei. mid-infrared t-ReCS/Gemini spectra using the new RedCan pipeline . A&A , 553 pp. 35, May 2013.
- [goulding_towards_2009] A. D. Goulding and D. M. Alexander. Towards a complete census of AGN in nearby galaxies: a large population of optically unidentified AGN . MNRAS , 398 pp. 1165–1193, September 2009.
- [greenhill_discovery_2003] L. J. Greenhill, P. T. Kondratko, J. E. J. Lovell, T. B. H. Kuiper, J. M. Moran, D. L. Jauncey, and G. P. Baines. The discovery of H2O maser emission in seven active galactic nuclei and at high velocities in the circinus galaxy . ApJL , 582 pp. L11–L14, January 2003.
- [honig_dusty_2010-1] S. F. Hönig, M. Kishimoto, P. Gandhi, A. Smette, D. Asmus, W. Duschl, M. Polletta, and G. Weigelt. The dusty heart of nearby active galaxies. i. high-spatial resolution mid-IR spectro-photometry of seyfert galaxies . A&A , 515 pp. 23, June 2010.
- [leipski_radio_2006] C. Leipski, H. Falcke, N. Bennert, and S. Hüttemeister. The radio structure of radio-quiet quasars . A&A , 455 pp. 161–172, August 2006.
- [morris_velocity_1985] S. Morris, M. Ward, M. Whittle, A. S. Wilson, and K. Taylor. The velocity fields and radio structures of the active galaxies NGC 5643 and NGC 7582 . MNRAS , 216 pp. 193–217, September 1985.
- [rigopoulou_large_1999] D. Rigopoulou, H. W. W. Spoon, R. Genzel, D. Lutz, A. F. M. Moorwood, and Q. D. Tran. A large mid-infrared spectroscopic and near-infrared imaging survey of ultraluminous infrared galaxies: Their nature and evolution . AJ , 118 pp. 2625–2645, December 1999.
- [roche_atlas_1991] Patrick F. Roche, David K. Aitken, Craig H. Smith, and Martin J. Ward. An atlas of mid-infrared spectra of galaxy nuclei . MNRAS , 248 pp. 606–629, February 1991.
- [shi_9.7_2006] Y. Shi, G. H. Rieke, D. C. Hines, V. Gorjian, M. W. Werner, K. Cleary, F. J. Low, P. S. Smith, and J. Bouwman. 9.7 μm silicate features in active galactic nuclei: New insights into unification models . ApJ , 653 pp. 127–136, December 2006.
- [siebenmorgen_mid-infrared_2004] R. Siebenmorgen, E. Krügel, and H. W. W. Spoon. Mid-infrared emission of galactic nuclei. TIMMI2 versus ISO observations and models . A&A , 414 pp. 123–139, January 2004.
- [simpson_one-sided_1997] Chris Simpson, A. S. Wilson, Gary Bower, T. M. Heckman, J. H. Krolik, and G. K. Miley. A one-sided ionization cone in the seyfert 2 galaxy NGC 5643 . ApJ , 474 pp. 121, January 1997.
- [tully_nearby_1988] R. Brent Tully. Nearby galaxies catalog . Cambridge University Press, 1988.
- [veron-cetty_catalogue_2010] M.-P. Véron-Cetty and P. Véron. A catalogue of quasars and active nuclei: 13th edition . A&A , 518 pp. 10, July 2010.
Images
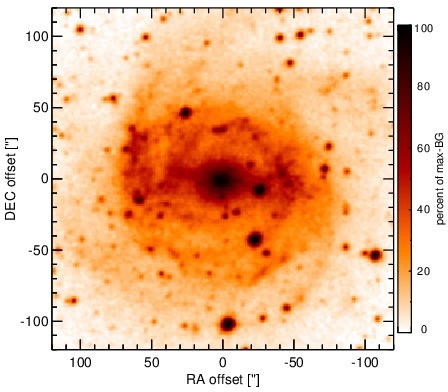
Optical image (DSS, red filter). Displayed are the central 4 arcmin with North being up and East to the left. The colour scaling is linear with white corresponding to the median background (BG) and black to the 0.01% pixels with the highest intensity.
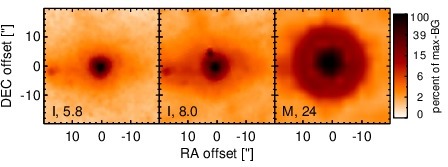
Spitzer MIR images. Displayed are the inner 40 arcsec with North being up and East to the left. The colour scaling is logarithmic with white corresponding to median BG and black to the 0.1% pixels with the highest intensity. The label in the bottom left states instrument and central wavelength of the filter in micron (I: IRAC, M: MIPS).
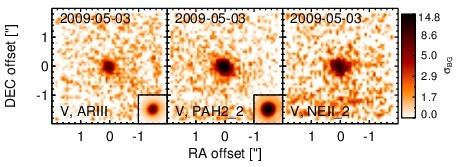
Subarcsecond-resolution MIR images sorted by increasing filter central wavelength. Displayed are the inner 4 arcsec with North being up and East to the left. The colour scaling is logarithmic with white corresponding to median BG and black to the 75% of the highest intensity of all images in units of sig_bg. The inset image (where present; either bottom or top right) shows the central arcsecond of the PSF from the calibrator star, scaled to match the science target. The labels in the bottom left state instrument and filter names (C: COMICS, M: Michelle, T: T-ReCS, V: VISIR).
SEDs
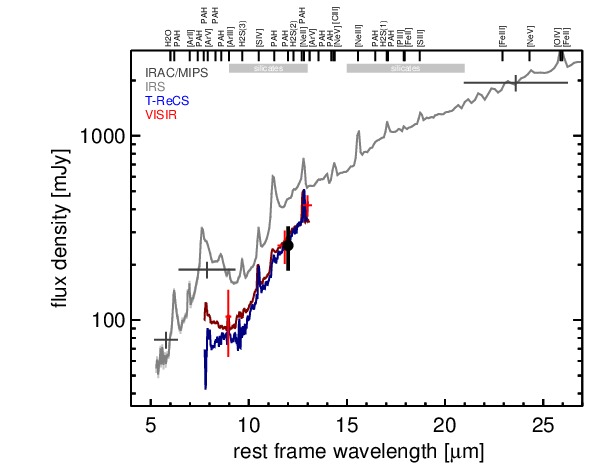
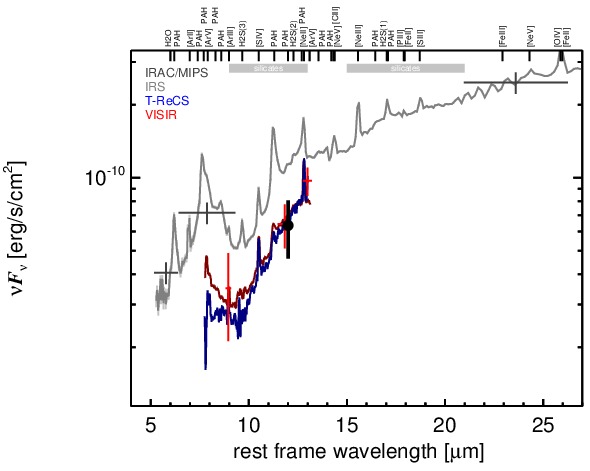
MIR SED. The description of the symbols in all the SED plots (where present) is the following: Grey crosses and solid lines mark the Spitzer/IRAC, MIPS and IRS data. The colour coding of the other symbols is as follows: green for COMICS, magenta for Michelle, blue for T-ReCS and red for VISIR data. Darker-coloured solid lines mark spectra of the corresponding instrument. The black filled circles mark the nuclear 12 and 18 micron continuum emission estimate from the data (where present). The ticks on the top axis mark positions of common MIR emission lines, while the light grey horizontal bars mark wavelength ranges affected by the silicate 10 and 18 micron features.