Sasmirala Individual Information for NGC 5813
Description
NGC 5813 is a passive elliptical galaxy at a distance of D = 29.7 ± 1.8 Mpc (NED redshift-independent median) with evidence for past AGN outbursts [randall_shocks_2011]. It possibly still contains a LINER nucleus [ho_search_1997-1]. However, indications for a nuclear X-ray compact source are inconclusive [gonzalez-martin_x-ray_2009, gonzalez-martin_fitting_2009, randall_shocks_2011]. On the other hand, a compact radio core was detected [wrobel_radio-continuum_1991, nagar_radio_2005]. We treat NGC 5813 conservatively as an uncertain AGN. The nucleus contains a dusty circum-nuclear disc with ~ 1.4arcsec ~ 200 pc diameter and PA~ 150∘ [tran_dusty_2001]. The first attempt to detect the nucleus of NGC 5813 in the MIR from the ground failed [impey_infrared_1986]. Successful MIR observations were carried out with ISO [ferrari_survey_2002] and Spitzer/IRAC, IRS and MIPS. The corresponding IRAC and MIPS images show centrally-peaked, yet diffuse host emission without a clearly separable nuclear component. We measure the flux of the central four (seven for MIPS) arcsecond region, which provides IRAC 5.8 and 8.0 μm and MIPS 24 μm fluxes significantly lower than the fluxes in the literature [temi_mid-infrared_2005, temi_far-infrared_2007, temi_spitzer_2009]. The IRS LR staring-mode spectrum exhibits a MIR SED typical of a passive old stellar population without any prominent spectral features and a blue spectral slope in νFν-space (see also [bregman_ages_2006]). We observed the nuclear region of NGC 5813 with VISIR in 2009 with two narrow N-band filters but failed to detect any MIR emission [asmus_mid-infrared_2011]. The corresponding flux upper limits are well above the Spitzer spectrophotometry, and thus we use the latter as an upper limit for the 12 μm continuum emission of any putative AGN component in NGC 5813.
- [asmus_mid-infrared_2011] D. Asmus, P. Gandhi, A. Smette, S. F. Hönig, and W. J. Duschl. Mid-infrared properties of nearby low-luminosity AGN at high angular resolution . A&A , 536 pp. 36, December 2011.
- [bregman_ages_2006] Joel N. Bregman, Pasquale Temi, and Jesse D. Bregman. The ages of elliptical galaxies from infrared spectral energy distributions . ApJ , 647 pp. 265–275, August 2006.
- [ferrari_survey_2002] F. Ferrari, M. G. Pastoriza, F. D. Macchetto, C. Bonatto, N. Panagia, and W. B. Sparks. Survey of the ISM in early-type galaxies. IV. the hot dust component . A&A , 389 pp. 355–366, July 2002.
- [gonzalez-martin_fitting_2009] O. González-Martín, J. Masegosa, I. Márquez, and M. Guainazzi. Fitting liner nuclei within the active galactic nucleus family: A matter of obscuration? . ApJ , 704 pp. 1570–1585, October 2009.
- [gonzalez-martin_x-ray_2009] O. González-Martín, J. Masegosa, I. Márquez, M. Guainazzi, and E. Jiménez-Bailón. An x-ray view of 82 LINERs with chandra and XMM-Newton data . A&A , 506 pp. 1107–1121, November 2009.
- [ho_search_1997-1] Luis C. Ho, Alexei V. Filippenko, and Wallace L. W. Sargent. A search for ``Dwarf'' seyfert nuclei. III. spectroscopic parameters and properties of the host galaxies . ApJS , 112 pp. 315, October 1997.
- [impey_infrared_1986] C. D. Impey, C. G. Wynn-Williams, and E. E. Becklin. Infrared studies of elliptical galaxies. i - an optically selected sample . ApJ , 309 pp. 572–592, October 1986.
- [nagar_radio_2005] N. M. Nagar, H. Falcke, and A. S. Wilson. Radio sources in low-luminosity active galactic nuclei. IV. radio luminosity function, importance of jet power, and radio properties of the complete palomar sample . A&A , 435 pp. 521–543, May 2005.
- [randall_shocks_2011] S. W. Randall, W. R. Forman, S. Giacintucci, P. E. J. Nulsen, M. Sun, C. Jones, E. Churazov, L. P. David, R. Kraft, M. Donahue, E. L. Blanton, A. Simionescu, and N. Werner. Shocks and cavities from multiple outbursts in the galaxy group NGC 5813: A window to active galactic nucleus feedback . ApJ , 726 pp. 86, January 2011.
- [temi_far-infrared_2007] Pasquale Temi, Fabrizio Brighenti, and William G. Mathews. Far-infrared spitzer observations of elliptical galaxies: Evidence for extended diffuse dust . ApJ , 660 pp. 1215–1231, May 2007.
- [temi_mid-infrared_2005] Pasquale Temi, Fabrizio Brighenti, and William G. Mathews. Mid-infrared emission from elliptical galaxies: Sensitivity to stellar age . ApJL , 635 pp. L25–L28, December 2005.
- [temi_spitzer_2009] Pasquale Temi, Fabrizio Brighenti, and William G. Mathews. Spitzer observations of passive and star-forming early-type galaxies: An infrared color-color sequence . ApJ , 707 pp. 890–902, December 2009.
- [tran_dusty_2001] H. D. Tran, Z. Tsvetanov, H. C. Ford, J. Davies, W. Jaffe, F. C. van den Bosch, and A. Rest. Dusty nuclear disks and filaments in early-type galaxies . AJ , 121 pp. 2928–2942, June 2001.
- [wrobel_radio-continuum_1991] J. M. Wrobel and D. S. Heeschen. Radio-continuum sources in nearby and bright E/S0 galaxies - active nuclei versus star formation . AJ , 101 pp. 148–169, January 1991.
Images

Optical image (DSS, red filter). Displayed are the central 4 arcmin with North being up and East to the left. The colour scaling is linear with white corresponding to the median background (BG) and black to the 0.01% pixels with the highest intensity.
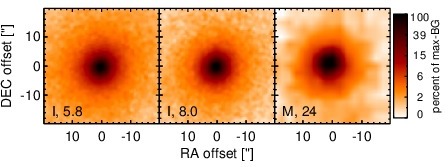
Spitzer MIR images. Displayed are the inner 40 arcsec with North being up and East to the left. The colour scaling is logarithmic with white corresponding to median BG and black to the 0.1% pixels with the highest intensity. The label in the bottom left states instrument and central wavelength of the filter in micron (I: IRAC, M: MIPS).
SEDs
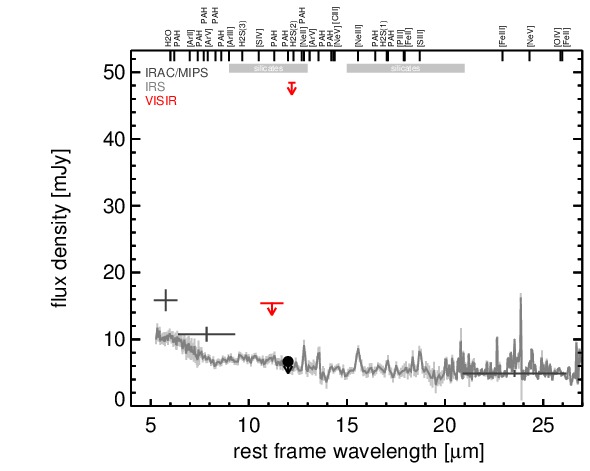
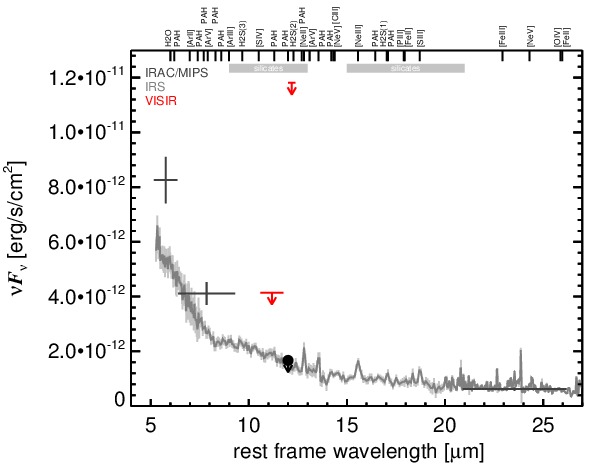
MIR SED. The description of the symbols in all the SED plots (where present) is the following: Grey crosses and solid lines mark the Spitzer/IRAC, MIPS and IRS data. The colour coding of the other symbols is as follows: green for COMICS, magenta for Michelle, blue for T-ReCS and red for VISIR data. Darker-coloured solid lines mark spectra of the corresponding instrument. The black filled circles mark the nuclear 12 and 18 micron continuum emission estimate from the data (where present). The ticks on the top axis mark positions of common MIR emission lines, while the light grey horizontal bars mark wavelength ranges affected by the silicate 10 and 18 micron features.