Sasmirala Individual Information for NGC 5953
Description
NGC 5953 is a lenticular galaxy at a redshift of z = 0.0066 (D ~ 31.4 Mpc) which heavily interacts with NGC 5954 to the north-east at a projected distance of D = ~ 43arcsec (~ 6 kpc). BOth galaxies form the pair Arp 91 (see [casasola_molecular_2010] for a recent detailed study). NGC 5953 hosts an AGN optically classified either as a Sy 2 [gonzalez_delgado_circumnuclear_1996, goncalves_agns_1999], LINER [veilleux_optical_1995, kim_optical_1995], or AGN/starburst composite [veron_agns_1997]. The AGN is embedded within a disc-like circum-nuclear starburst with a diameter of ~ 12arcsec ~ 1.8 kpc [gonzalez_delgado_circumnuclear_1996, casasola_molecular_2010] Nuclear X-ray emission is only detected in the soft band [guainazzi_x-ray_2005, lamassa_uncovering_2011] A compact radio core with jet-like extension of ~ 1arcsec in PA~ 20∘ [jenkins_arp_1984, krips_nuclei_2007] and roughly cospatial [O III] emission are present. [gonzalez_delgado_circumnuclear_1996]. After its detection with IRAS, NGC 5953 was followed up with ground-based MIR photometry [cutri_statistical_1985, wright_recent_1988, maiolino_new_1995] and space-based MIR spectrophotometry with ISO [clavel_2.5-11_2000, ramos_almeida_mid-infrared_2007]. The nucleus remained undetected in the first subarcsecond MIR imaging observations [gorjian_10_2004]. A compact nucleus embedded within the star-formation disc with a diameter of ~ 12arcsec is visible in the Spitzer/IRAC 5.8 μm image. In the Spitzer/IRAC 8.0 μm and MIPS 24 μm image, this disc dominates the MIR emission with the brightest location being a compact region at the south-western tip of the disc. Therefore, our corresponding photometry of the unresolved nuclear component is significantly lower than the fluxes published in the literature [engelbracht_metallicity_2008, gallimore_infrared_2010]. The Spitzer/IRS LR staring-mode spectrum is dominated by strong PAH emission and shows a red spectral slope in νFν-space (see also [buchanan_spitzer_2006, wu_spitzer/irs_2009, gallimore_infrared_2010]. Thus, the arcsecond-scale MIR SED is completely star-formation dominated. The nuclear region of NGC 5953 was observed with T-ReCS in the broad N filter in 2004 [videla_nuclear_2013]). In the image, an extended nucleus is faintly visible (S/N~ 1), surrounded by a ring-like structure corresponding to the star-formation disc. Therefore, we use a measurement of the unresolved central component to determine an upper limit on the nuclear flux, which makes up only ~ 14% of the flux seen in the arcsecond-scale MIR SED as probed by Spitzer. This nuclear value is presumably still affected by star formation. On the other hand, the AGN-indicative [Ne V] was detected in the IRS spectrum (e.g. [gallimore_infrared_2010]).
- [buchanan_spitzer_2006] Catherine L. Buchanan, Jack F. Gallimore, Christopher P. O'Dea, Stefi A. Baum, David J. Axon, Andrew Robinson, Moshe Elitzur, and Martin Elvis. Spitzer IRS spectra of a large sample of seyfert galaxies: A variety of infrared spectral energy distributions in the local active galactic nucleus population . AJ , 132 pp. 401–419, July 2006.
- [casasola_molecular_2010] V. Casasola, L. K. Hunt, F. Combes, S. García-Burillo, F. Boone, A. Eckart, R. Neri, and E. Schinnerer. Molecular gas in NUclei of GAlaxies (NUGA) XIII. the interacting seyfert 2/LINER galaxy NGC 5953 . A&A , 510 pp. 52, February 2010.
- [clavel_2.5-11_2000] J. Clavel, B. Schulz, B. Altieri, P. Barr, P. Claes, A. Heras, K. Leech, L. Metcalfe, and A. Salama. 2.5-11 micron spectroscopy and imaging of AGNs. implication for unification schemes . A&A , 357 pp. 839–849, May 2000.
- [cutri_statistical_1985] R. M. Cutri and C. W. McAlary. A statistical study of the relationship between galaxy interactions and nuclear activity . ApJ , 296 pp. 90–105, September 1985.
- [engelbracht_metallicity_2008] C. W. Engelbracht, G. H. Rieke, K. D. Gordon, J.-D. T. Smith, M. W. Werner, J. Moustakas, C. N. A. Willmer, and L. Vanzi. Metallicity effects on dust properties in starbursting galaxies . ApJ , 678 pp. 804–827, May 2008.
- [gallimore_infrared_2010] J. F. Gallimore, A. Yzaguirre, J. Jakoboski, M. J. Stevenosky, D. J. Axon, S. A. Baum, C. L. Buchanan, M. Elitzur, M. Elvis, C. P. O'Dea, and A. Robinson. Infrared spectral energy distributions of seyfert galaxies: Spitzer space telescope observations of the 12 μm sample of active galaxies . ApJS , 187 pp. 172–211, March 2010.
- [goncalves_agns_1999] A. C. Gonçalves, M.-P. Véron-Cetty, and P. Véron. AGNs with composite spectra. II. additional data . A&AS , 135 pp. 437–466, March 1999.
- [gonzalez_delgado_circumnuclear_1996] Rosa M. Gonzalez Delgado and Enrique Perez. The circumnuclear region in the seyfert 2 galaxy NGC 5953 . MNRAS , 281 pp. 781–798, August 1996.
- [gorjian_10_2004] V. Gorjian, M. W. Werner, T. H. Jarrett, D. M. Cole, and M. E. Ressler. 10 micron imaging of seyfert galaxies from the 12 micron sample . ApJ , 605 pp. 156–167, April 2004.
- [guainazzi_x-ray_2005] M. Guainazzi, G. Matt, and G. C. Perola. X-ray obscuration and obscured AGN in the local universe . A&A , 444 pp. 119–132, December 2005.
- [jenkins_arp_1984] C. R. Jenkins. ARP 91 - interaction and star formationin a galaxy pair . ApJ , 277 pp. 501–512, February 1984.
- [kim_optical_1995] D.-C. Kim, D. B. Sanders, S. Veilleux, J. M. Mazzarella, and B. T. Soifer. Optical spectroscopy of luminous infrared galaxies. i. nuclear data . ApJS , 98 pp. 129, May 1995.
- [krips_nuclei_2007] M. Krips, A. Eckart, T. P. Krichbaum, J.-U. Pott, S. Leon, R. Neri, S. García-Burillo, F. Combes, F. Boone, A. J. Baker, L. J. Tacconi, E. Schinnerer, and L. K. Hunt. NUclei of GAlaxies. v. radio emission in 7 NUGA sources . A&A , 464 pp. 553–563, March 2007.
- [lamassa_uncovering_2011] Stephanie M. LaMassa, T. M. Heckman, A. Ptak, L. Martins, V. Wild, P. Sonnentrucker, and A. Hornschemeier. Uncovering obscured active galactic nuclei in homogeneously selected samples of seyfert 2 galaxies . ApJ , 729 pp. 52, March 2011.
- [maiolino_new_1995] R. Maiolino, M. Ruiz, G. H. Rieke, and L. D. Keller. New constraints on the unified model of seyfert galaxies . ApJ , 446 pp. 561, June 1995.
- [ramos_almeida_mid-infrared_2007] C. Ramos Almeida, A. M. Pérez García, J. A. Acosta-Pulido, and J. M. Rodríguez Espinosa. The mid-infrared emission of seyfert galaxies: A new analysis of ISOCAM data . AJ , 134 pp. 2006–2019, November 2007.
- [veilleux_optical_1995] S. Veilleux, D.-C. Kim, D. B. Sanders, J. M. Mazzarella, and B. T. Soifer. Optical spectroscopy of luminous infrared galaxies. II. analysis of the nuclear and long-slit data . ApJS , 98 pp. 171, May 1995.
- [veron_agns_1997] P. Veron, A. C. Goncalves, and M.-P. Veron-Cetty. AGNs with composite spectra. . A&A , 319 pp. 52–66, March 1997.
- [videla_nuclear_2013] Liza Videla, Paulina Lira, Heather Andrews, Almudena Alonso-Herrero, David M. Alexander, and Martin Ward. Nuclear infrared spectral energy distribution of type II active galactic nuclei . ApJS , 204 pp. 23, February 2013.
- [wright_recent_1988] G. S. Wright, R. D. Joseph, N. A. Robertson, P. A. James, and W. P. S. Meikle. Recent star formation in interacting galaxies. III - evidence from mid-infrared photometry . MNRAS , 233 pp. 1–23, July 1988.
- [wu_spitzer/irs_2009] Yanling Wu, Vassilis Charmandaris, Jiasheng Huang, Luigi Spinoglio, and Silvia Tommasin. Spitzer/IRS 5-35 μm low-resolution spectroscopy of the 12 μm seyfert sample . ApJ , 701 pp. 658–676, August 2009.
Images
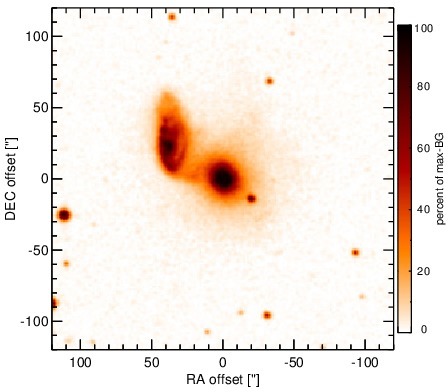
Optical image (DSS, red filter). Displayed are the central 4 arcmin with North being up and East to the left. The colour scaling is linear with white corresponding to the median background (BG) and black to the 0.01% pixels with the highest intensity.
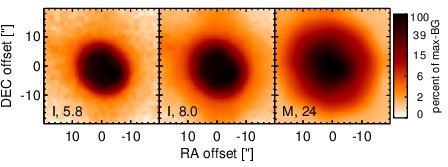
Spitzer MIR images. Displayed are the inner 40 arcsec with North being up and East to the left. The colour scaling is logarithmic with white corresponding to median BG and black to the 0.1% pixels with the highest intensity. The label in the bottom left states instrument and central wavelength of the filter in micron (I: IRAC, M: MIPS).
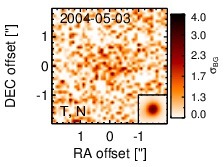
Subarcsecond-resolution MIR images sorted by increasing filter central wavelength. Displayed are the inner 4 arcsec with North being up and East to the left. The colour scaling is logarithmic with white corresponding to median BG and black to the 75% of the highest intensity of all images in units of sig_bg. The inset image (where present; either bottom or top right) shows the central arcsecond of the PSF from the calibrator star, scaled to match the science target. The labels in the bottom left state instrument and filter names (C: COMICS, M: Michelle, T: T-ReCS, V: VISIR).
SEDs
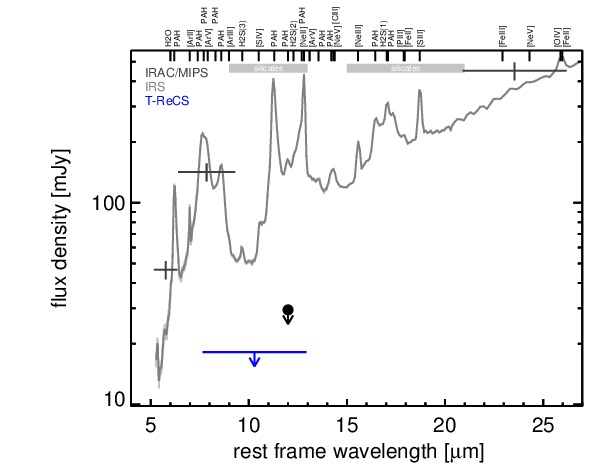
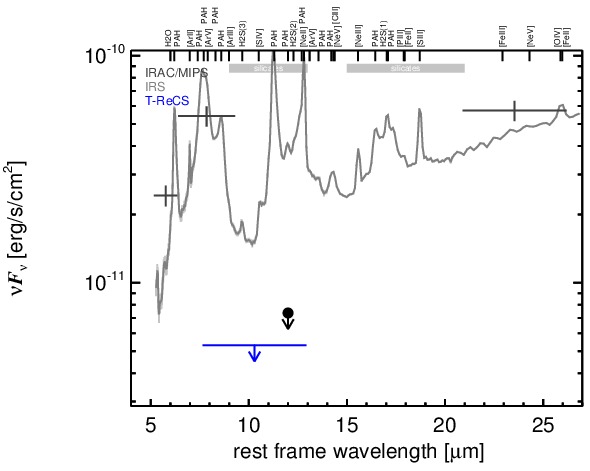
MIR SED. The description of the symbols in all the SED plots (where present) is the following: Grey crosses and solid lines mark the Spitzer/IRAC, MIPS and IRS data. The colour coding of the other symbols is as follows: green for COMICS, magenta for Michelle, blue for T-ReCS and red for VISIR data. Darker-coloured solid lines mark spectra of the corresponding instrument. The black filled circles mark the nuclear 12 and 18 micron continuum emission estimate from the data (where present). The ticks on the top axis mark positions of common MIR emission lines, while the light grey horizontal bars mark wavelength ranges affected by the silicate 10 and 18 micron features.