Sasmirala Individual Information for NGC 6251
Description
NGC 6251 is an elliptical galaxy at a redshift of z = 0.0247 (D ~ 112 Mpc) hosting one of the largest radio sources in the sky [waggett_ngc_1977] and classified as FR I/II. It consists of giant double lobes with an S-shaped geometry (see [migliori_implications_2011] for a recent SED study). Its nucleus is active but with uncertain classification. Initially, it was optically classified as a Sy 2 [shuder_empirical_1981], while its optical emission line ratios are more LINER-like [ferrarese_nuclear_1999], and the detection of a broad Hα component would lead to a Sy 1 classification (see discussion in [shi_unobscured_2010]). At radio wavelengths, the nucleus is unresolved with a one-sided narrow jet extending on kiloparsec scales toward the north-west (PA~ 296∘; [perley_high-resolution_1984, jones_high_1986]). A highly inclined dust disc with a major axis diameter of ~ 1.4arcsec ~ 0.7 kpc surrounds the nucleus (PA~ 0∘; [ferrarese_nuclear_1999]). NGC 6251 was first observed in the MIR with IRAS and later followed up with Spitzer/IRAC, IRS and MIPS. The corresponding IRAC and MIPS images show a compact nucleus embedded within diffuse host emission with no signs of jet emission. Our nuclear MIPS 24 μm photometry is consistent with [shi_unobscured_2010]. The IRS LR staring-mode spectrum exhibits strong silicate 10 and 18 μm emission, a very weak PAH 11.3 μm feature and a shallow blue spectral slope in νFν-space (see also [leipski_spitzer_2009, shi_unobscured_2010]). Thus, the arcsecond-scale MIR SED indicates the presence of large amounts of warm dust and supports the unobscured LINER or type I scenario. The nuclear region of NGC 6251 was imaged with COMICS in the N11.7 filter in 2009 (unpublished, to our knowledge). In the image, an elongated nucleus was detected without any further emission (FWHM(major axis)~ 0.57arcsec; PA~ 143∘). We consider it likely that this apparent extension is in fact an artefact, because only a single low S/N image taken at very high airmass is available, and the nuclear source morphology is suspicious while not matching any other wavelength. Therefore, the nuclear extension of NGC 6251 remains uncertain at subarcsecond scales in the MIR. The nuclear N11.7 flux is ~ 62% lower than the Spitzer spectrophotometry. From the current data, no inference about the properties of the nuclear MIR emission can be made.
- [ferrarese_nuclear_1999] Laura Ferrarese and Holland C. Ford. Nuclear disks of gas and dust in early-type galaxies and the hunt for massive black holes: Hubble space telescope observations of NGC 6251 . ApJ , 515 pp. 583–602, April 1999.
- [jones_high_1986] Dayton L. Jones, S. C. Unwin, A. C. S. Readhead, W. L. W. Sargent, G. A. Seielstad, R. S. Simon, R. C. Walker, J. M. Benson, R. A. Perley, A. H. Bridle, I. I. K. Pauliny-Toth, J. Romney, A. Witzel, P. N. Wilkinson, L. B. Baath, R. S. Booth, D. N. Fort, J. A. Galt, R. L. Mutel, and R. P. Linfield. High dynamic range VLBI observations of NGC 6251 . ApJ , 305 pp. 684–697, June 1986.
- [leipski_spitzer_2009] C. Leipski, R. Antonucci, P. Ogle, and D. Whysong. The spitzer view of FR i radio galaxies: On the origin of the nuclear mid-infrared continuum . ApJ , 701 pp. 891–914, August 2009.
- [migliori_implications_2011] G. Migliori, P. Grandi, E. Torresi, C. Dermer, J. Finke, A. Celotti, R. Mukherjee, M. Errando, F. Gargano, F. Giordano, and M. Giroletti. Implications for the structure of the relativistic jet from multiwavelength observations of NGC 6251 . A&A , 533 pp. 72, September 2011.
- [perley_high-resolution_1984] R. A. Perley, A. H. Bridle, and A. G. Willis. High-resolution VLA observations of the radio jet in NGC 6251 . ApJS , 54 pp. 291–334, February 1984.
- [shi_unobscured_2010] Yong Shi, George H. Rieke, Paul Smith, Jane Rigby, Dean Hines, Jennifer Donley, Gary Schmidt, and Aleksandar M. Diamond-Stanic. Unobscured type 2 active galactic nuclei . ApJ , 714 pp. 115–129, May 2010.
- [shuder_empirical_1981] J. M. Shuder and D. E. Osterbrock. Empirical results from a study of active galactic nuclei . ApJ , 250 pp. 55–65, November 1981.
- [waggett_ngc_1977] P. C. Waggett, P. J. Warner, and J. E. Baldwin. NGC 6251, a very large radio galaxy with an exceptional jet . MNRAS , 181 pp. 465–474, November 1977.
Images
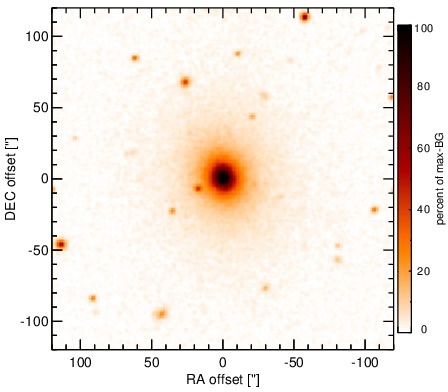
Optical image (DSS, red filter). Displayed are the central 4 arcmin with North being up and East to the left. The colour scaling is linear with white corresponding to the median background (BG) and black to the 0.01% pixels with the highest intensity.
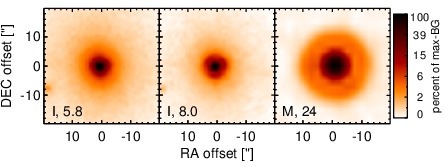
Spitzer MIR images. Displayed are the inner 40 arcsec with North being up and East to the left. The colour scaling is logarithmic with white corresponding to median BG and black to the 0.1% pixels with the highest intensity. The label in the bottom left states instrument and central wavelength of the filter in micron (I: IRAC, M: MIPS).
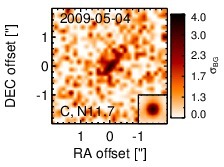
Subarcsecond-resolution MIR images sorted by increasing filter central wavelength. Displayed are the inner 4 arcsec with North being up and East to the left. The colour scaling is logarithmic with white corresponding to median BG and black to the 75% of the highest intensity of all images in units of sig_bg. The inset image (where present; either bottom or top right) shows the central arcsecond of the PSF from the calibrator star, scaled to match the science target. The labels in the bottom left state instrument and filter names (C: COMICS, M: Michelle, T: T-ReCS, V: VISIR).
SEDs
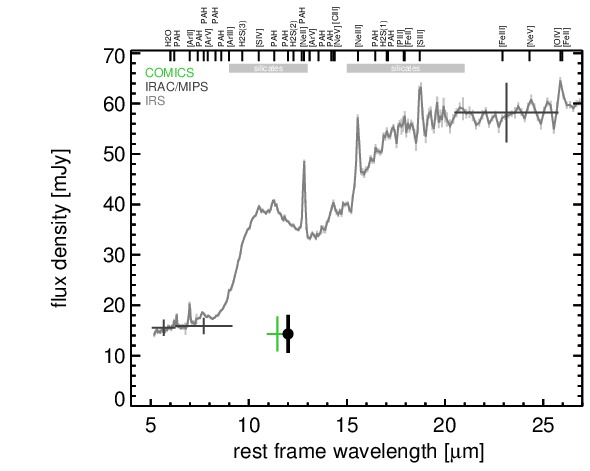
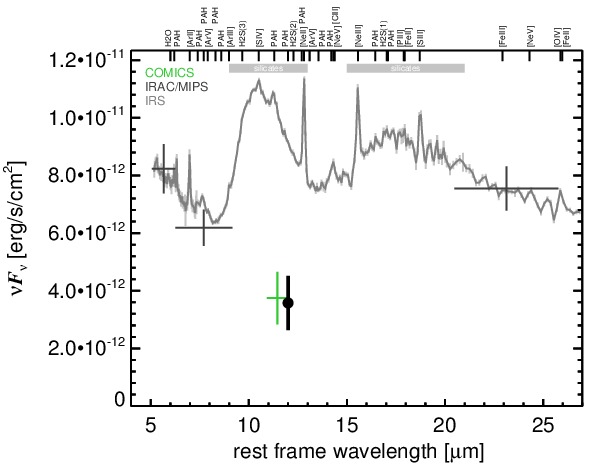
MIR SED. The description of the symbols in all the SED plots (where present) is the following: Grey crosses and solid lines mark the Spitzer/IRAC, MIPS and IRS data. The colour coding of the other symbols is as follows: green for COMICS, magenta for Michelle, blue for T-ReCS and red for VISIR data. Darker-coloured solid lines mark spectra of the corresponding instrument. The black filled circles mark the nuclear 12 and 18 micron continuum emission estimate from the data (where present). The ticks on the top axis mark positions of common MIR emission lines, while the light grey horizontal bars mark wavelength ranges affected by the silicate 10 and 18 micron features.