Sasmirala Individual Information for NGC 7130
Description
NGC 7130 is a peculiar low-inclination spiral galaxy at a redshift of z = 0.0162 (D ~ 68.9 Mpc) with an active nucleus containing both an AGN and a powerful compact starburst [thuan_ultraviolet_1984, gonzalez_delgado_ultraviolet-optical_1998, levenson_deconstructing_2005]. The nuclear starburst extends over the central ~ 1arcsec ~ 0.3 kpc. The AGN is optically classified as a Sy 1.9 nucleus [veron-cetty_catalogue_2010], Sy 2 [phillips_nearby_1983] and LINER [kim_optical_1995, veilleux_optical_1995], and we treat it as AGN/starburst composite. NGC 7130 features a compact radio core, which has a slightly elongated component with ~ 3arcsec ~1 kpc length along a PA~ 0∘ [norris_compact_1990, thean_high-resolution_2000]. The [O III] emission is compact and unresolved on arcsecond scales [shields_emission-line_1990]. After being detected in the MIR with IRAS for the first time, NGC 7130 was followed up in the MIR with IRTF [wynn-williams_luminous_1993] and Spitzer/IRAC, IRS and MIPS. The corresponding IRAC and MIPS images show an extended, bright nucleus embedded within spiral-like host emission. Our nuclear IRAC 5.8 and 8.0μm photometry is significantly lower than the values published by [gallimore_infrared_2010] but roughly agree with the Spitzer/IRS staring-mode post-BCD spectrum. The latter exhibits silicate 10 μm absorption, strong PAH features and a steep red spectral slope in νFν-space (see also [buchanan_spitzer_2006, shi_9.7_2006, wu_spitzer/irs_2009, tommasin_spitzer-irs_2010, gallimore_infrared_2010]). Thus, the arcsecond-scale MIR SED indicates obscured AGN emission with a high star-formation contribution (see also [alonso-herrero_local_2012]). The nuclear region of NGC 7130 was imaged with T-ReCS in the broad N-band filter [alonso-herrero_high_2006, diaz-santos_understanding_2008], and a T-ReCS LR N-band spectrum was taken subsequently [diaz-santos_high_2010, gonzalez-martin_dust_2013]. In addition, it was imaged with VISIR in five different narrow N-band filters in 2009 (unpublished, to our knowledge). A compact nucleus was detected in all images, while the largest-FOV T-ReCS image also shows extended diffuse emission to the north as well as a compact source ~ 10arcsec ~ 3.2 kpc to the north (PA~-12∘). [alonso-herrero_high_2006] identifies the off-nuclear emission with H II regions. The nucleus appears marginally resolved (but not significantly elongated) in all images (median FWHM~ 0.56arcsec ~ 180 pc) and, thus, is classified as extended. Accordingly, we measure only the unresolved nuclear flux, which provides results generally consistent with the PSF-extracted T-ReCS spectrum from [gonzalez-martin_dust_2013], but is systematically lower by a few percent. The exceptions to this are the PAH-probing PAH1 and B11.7 fluxes, which are significantly lower and thus possibly hint at lower PAH emission in the central ~ 100 pc. The nuclear MIR SED has on average ~ 59% lower fluxes than the Spitzer spectrophotometry while exhibiting a similar silicate 10 μm absorption strength. Despite being weaker, PAH emission might still be present on subarcsecond resolution. We conclude that the nuclear MIR SED is presumably still affected by significant star-formation emission and, thus, should be regarded as an upper limit to the MIR emission by the AGN (but see also [gonzalez-martin_dust_2013]).
- [alonso-herrero_high_2006] Almudena Alonso-Herrero, Luis Colina, Christopher Packham, Tanio Díaz-Santos, George H. Rieke, James T. Radomski, and Charles M. Telesco. High spatial resolution t-ReCS mid-infrared imaging of luminous infrared galaxies . ApJ , 652 pp. L83–L87, December 2006.
- [alonso-herrero_local_2012] Almudena Alonso-Herrero, Miguel Pereira-Santaella, George H. Rieke, and Dimitra Rigopoulou. Local luminous infrared galaxies. II. active galactic nucleus activity from Spitzer/Infrared spectrograph spectra . ApJ , 744 pp. 2, January 2012.
- [buchanan_spitzer_2006] Catherine L. Buchanan, Jack F. Gallimore, Christopher P. O'Dea, Stefi A. Baum, David J. Axon, Andrew Robinson, Moshe Elitzur, and Martin Elvis. Spitzer IRS spectra of a large sample of seyfert galaxies: A variety of infrared spectral energy distributions in the local active galactic nucleus population . AJ , 132 pp. 401–419, July 2006.
- [diaz-santos_high_2010] Tanio Díaz-Santos, Almudena Alonso-Herrero, Luis Colina, Christopher Packham, N. A. Levenson, Miguel Pereira-Santaella, Patrick F. Roche, and Charles M. Telesco. A high spatial resolution mid-infrared spectroscopic study of the nuclei and star-forming regions in luminous infrared galaxies . ApJ , 711 pp. 328–349, March 2010.
- [diaz-santos_understanding_2008] Tanio Díaz-Santos, Almudena Alonso-Herrero, Luis Colina, Christopher Packham, James T. Radomski, and Charles M. Telesco. Understanding the 8 μm versus paα relationship on subarcsecond scales in luminous infrared galaxies . ApJ , 685 pp. 211–224, September 2008.
- [gallimore_infrared_2010] J. F. Gallimore, A. Yzaguirre, J. Jakoboski, M. J. Stevenosky, D. J. Axon, S. A. Baum, C. L. Buchanan, M. Elitzur, M. Elvis, C. P. O'Dea, and A. Robinson. Infrared spectral energy distributions of seyfert galaxies: Spitzer space telescope observations of the 12 μm sample of active galaxies . ApJS , 187 pp. 172–211, March 2010.
- [gonzalez-martin_dust_2013] O. González-Martín, J. M. Rodríguez-Espinosa, T. Díaz-Santos, C. Packham, A. Alonso-Herrero, P. Esquej, C. Ramos Almeida, R. Mason, and C. Telesco. Dust in active galactic nuclei. mid-infrared t-ReCS/Gemini spectra using the new RedCan pipeline . A&A , 553 pp. 35, May 2013.
- [gonzalez_delgado_ultraviolet-optical_1998] Rosa M. González Delgado, Timothy Heckman, Claus Leitherer, Gerhardt Meurer, Julian Krolik, Andrew S. Wilson, Anne Kinney, and Anuradha Koratkar. Ultraviolet-optical observations of the seyfert 2 galaxies NGC 7130, NGC 5135, and IC 3639: Implications for the starburst-active galactic nucleus connection . ApJ , 505 pp. 174–198, September 1998.
- [kim_optical_1995] D.-C. Kim, D. B. Sanders, S. Veilleux, J. M. Mazzarella, and B. T. Soifer. Optical spectroscopy of luminous infrared galaxies. i. nuclear data . ApJS , 98 pp. 129, May 1995.
- [levenson_deconstructing_2005] N. A. Levenson, K. A. Weaver, T. M. Heckman, H. Awaki, and Y. Terashima. Deconstructing NGC 7130 . ApJ , 618 pp. 167–177, January 2005.
- [norris_compact_1990] R. P. Norris, M. J. Kesteven, E. R. Troup, D. A. Allen, and R. A. Sramek. Compact radio cores in extremely luminous far-infrared galaxies . ApJ , 359 pp. 291–295, August 1990.
- [phillips_nearby_1983] M. M. Phillips, P. A. Charles, and J. A. Baldwin. Nearby galaxies with seyfert-like nuclei . ApJ , 266 pp. 485–501, March 1983.
- [shi_9.7_2006] Y. Shi, G. H. Rieke, D. C. Hines, V. Gorjian, M. W. Werner, K. Cleary, F. J. Low, P. S. Smith, and J. Bouwman. 9.7 μm silicate features in active galactic nuclei: New insights into unification models . ApJ , 653 pp. 127–136, December 2006.
- [shields_emission-line_1990] Joseph C. Shields and Alexei V. Filippenko. Emission-line properties of the composite Seyfert/Starbust galaxy IC 5135 . AJ , 100 pp. 1034–1045, October 1990.
- [thean_high-resolution_2000] Andy Thean, Alan Pedlar, Marek J. Kukula, Stefi A. Baum, and Christopher P. O'Dea. High-resolution radio observations of seyfert galaxies in the extended 12-μm sample - i. the observations . MNRAS , 314 pp. 573–588, May 2000.
- [thuan_ultraviolet_1984] T. X. Thuan. Ultraviolet observations of starburst and mini-seyfert galactic nuclei . ApJ , 281 pp. 126–134, June 1984.
- [tommasin_spitzer-irs_2010] Silvia Tommasin, Luigi Spinoglio, Matthew A. Malkan, and Giovanni Fazio. Spitzer-IRS high-resolution spectroscopy of the 12 μm seyfert galaxies. II. results for the complete data set . ApJ , 709 pp. 1257–1283, February 2010.
- [veilleux_optical_1995] S. Veilleux, D.-C. Kim, D. B. Sanders, J. M. Mazzarella, and B. T. Soifer. Optical spectroscopy of luminous infrared galaxies. II. analysis of the nuclear and long-slit data . ApJS , 98 pp. 171, May 1995.
- [veron-cetty_catalogue_2010] M.-P. Véron-Cetty and P. Véron. A catalogue of quasars and active nuclei: 13th edition . A&A , 518 pp. 10, July 2010.
- [wu_spitzer/irs_2009] Yanling Wu, Vassilis Charmandaris, Jiasheng Huang, Luigi Spinoglio, and Silvia Tommasin. Spitzer/IRS 5-35 μm low-resolution spectroscopy of the 12 μm seyfert sample . ApJ , 701 pp. 658–676, August 2009.
- [wynn-williams_luminous_1993] C. G. Wynn-Williams and E. E. Becklin. Luminous infrared galaxies - sizes at 10-32 microns . ApJ , 412 pp. 535–540, August 1993.
Images
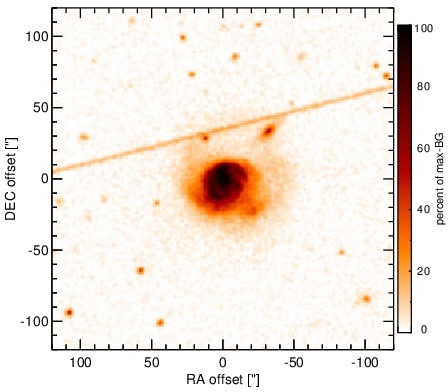
Optical image (DSS, red filter). Displayed are the central 4 arcmin with North being up and East to the left. The colour scaling is linear with white corresponding to the median background (BG) and black to the 0.01% pixels with the highest intensity.
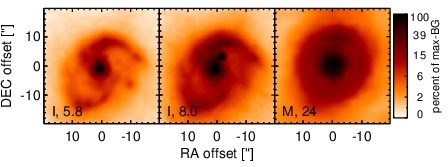
Spitzer MIR images. Displayed are the inner 40 arcsec with North being up and East to the left. The colour scaling is logarithmic with white corresponding to median BG and black to the 0.1% pixels with the highest intensity. The label in the bottom left states instrument and central wavelength of the filter in micron (I: IRAC, M: MIPS).
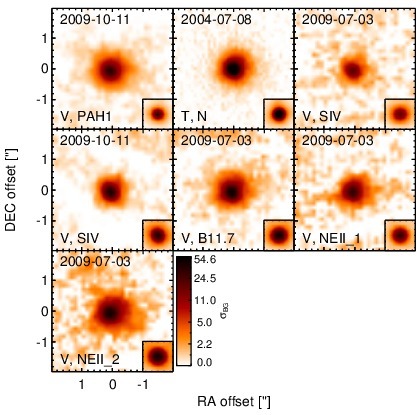
Subarcsecond-resolution MIR images sorted by increasing filter central wavelength. Displayed are the inner 4 arcsec with North being up and East to the left. The colour scaling is logarithmic with white corresponding to median BG and black to the 75% of the highest intensity of all images in units of sig_bg. The inset image (where present; either bottom or top right) shows the central arcsecond of the PSF from the calibrator star, scaled to match the science target. The labels in the bottom left state instrument and filter names (C: COMICS, M: Michelle, T: T-ReCS, V: VISIR).
SEDs
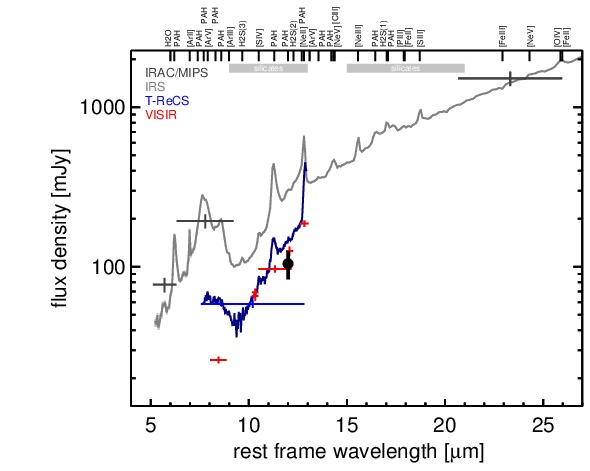
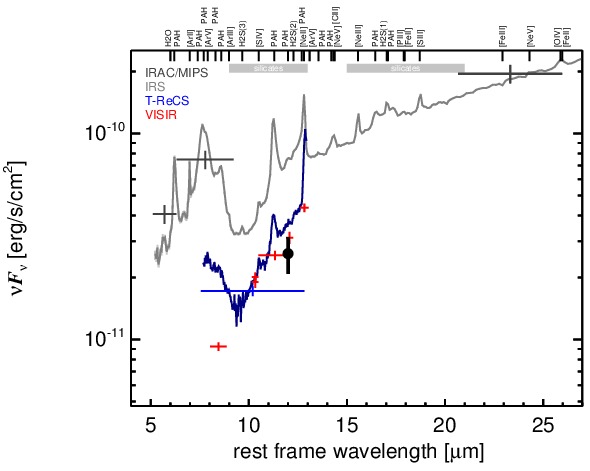
MIR SED. The description of the symbols in all the SED plots (where present) is the following: Grey crosses and solid lines mark the Spitzer/IRAC, MIPS and IRS data. The colour coding of the other symbols is as follows: green for COMICS, magenta for Michelle, blue for T-ReCS and red for VISIR data. Darker-coloured solid lines mark spectra of the corresponding instrument. The black filled circles mark the nuclear 12 and 18 micron continuum emission estimate from the data (where present). The ticks on the top axis mark positions of common MIR emission lines, while the light grey horizontal bars mark wavelength ranges affected by the silicate 10 and 18 micron features.