Sasmirala Individual Information for NGC 7172
Description
NGC 7172 is an edge-on lenticular galaxy at a redshift of z = 0.0087 (D ~ 34.8 Mpc) with a Sy 2 nucleus [veron-cetty_catalogue_2010] and a prominent dust lane projected onto the nucleus ([sharples_ngc_1984]; see [smajic_unveiling_2012] for a recent detailed study). It is variable by a factor of ~ two in X-rays (e.g. [akylas_bepposax_2001]) and belongs to the nine-month BAT AGN sample. Furthermore, it is an X-ray “buried” AGN candidate [noguchi_new_2009]. The nucleus is slightly resolved in arcsecond-resolution radio observations with extended emission of ~ 6arcsec ~ 1 kpc size along the host major axis (PA~ 90∘; [unger_radio_1987, morganti_radio_1999]). After first being detected in the MIR by IRAS, NGC 7172 was followed up with ground-based MIR observations [ward_continuum_1987, roche_atlas_1991]. The first subarcsecond N-band image was obtained with Palomar 5 m/MIRLIN in 2000 [gorjian_10_2004]. The Spitzer/IRAC and MIPS images show a compact nucleus embedded within the edge-on host emission. Our nuclear IRAC 5.8 and 8.0 μm photometry provides values significantly lower than those values in [johnson_infrared_2007, gallimore_infrared_2010] but significantly higher than the nuclear fluxes in [gallagher_revealing_2008], while roughly consistent with the Spitzer/IRS LR staring-mode post-BCD spectrum. The latter exhibits extremely deep silicate 10 μm and 18 μm absorption, significant PAH emission, and a generally blue spectral shape in νFν-space (see also [shi_9.7_2006, wu_spitzer/irs_2009, tommasin_spitzer-irs_2010, gallimore_infrared_2010]). Thus, the arcsecond-scale MIR SED is presumably affected by significant star formation. The nuclear region of NGC 7172 was imaged in the Si6 filter, and a LR N-band spectrum was taken with T-ReCS in 2004 [roche_silicate_2007, gonzalez-martin_dust_2013]. Note that [ramos_almeida_infrared_2009] report additional T-ReCS data in the broad N filter, which could not be successfully reduced with the midir and thus is not used. In addition, we imaged the nucleus with VISIR in total with three narrow N-band filters in 2006 [horst_mid_2008, horst_mid-infrared_2009] and in 2009. A compact nucleus was detected in all images, while part of the dust lane appears to be faintly visible in the Si6 image (diameter~ 1arcsec ~ 170 pc; PA~ 90∘). Note, however, that no matching standard star observation could be retrieved for the Si6 image, and, thus, it can only be used qualitatively for the extension analysis and be treated as upper limit on the unresolved nuclear emission. Similar to T-ReCS, the nucleus appears elongated also in the VISIR images (FWHM(major axis)~ 0.45arcsec ~ 75 pc; PA~ 90∘). Therefore, we measure only the unresolved nuclear flux, which provides values generally consistent with the T-ReCS N-band spectrum from [gonzalez-martin_dust_2013], but is systematically lower by ~ 10%. The resulting nuclear MIR SED is on average ~ 56% lower than the Spitzer spectrophotometry, exhibits a similar silicate 10 μm absorption feature but no PAH emission. Therefore, we assume that the nuclear MIR SED is free of star-formation contamination and use the T-ReCS spectrum to calculate the 12 μm continuum emission estimate corrected for the silicate feature.
- [akylas_bepposax_2001] A. Akylas, I. Georgantopoulos, and A. Comastri. BeppoSAX observations of the seyfert 2 galaxies NGC 7172 and ESO 103-g35 . MNRAS , 324 pp. 521–528, June 2001.
- [gallagher_revealing_2008] S. C. Gallagher, K. E. Johnson, A. E. Hornschemeier, J. C. Charlton, and J. E. Hibbard. The revealing dust: Mid-infrared activity in hickson compact group galaxy nuclei . ApJ , 673 pp. 730–741, February 2008.
- [gallimore_infrared_2010] J. F. Gallimore, A. Yzaguirre, J. Jakoboski, M. J. Stevenosky, D. J. Axon, S. A. Baum, C. L. Buchanan, M. Elitzur, M. Elvis, C. P. O'Dea, and A. Robinson. Infrared spectral energy distributions of seyfert galaxies: Spitzer space telescope observations of the 12 μm sample of active galaxies . ApJS , 187 pp. 172–211, March 2010.
- [gonzalez-martin_dust_2013] O. González-Martín, J. M. Rodríguez-Espinosa, T. Díaz-Santos, C. Packham, A. Alonso-Herrero, P. Esquej, C. Ramos Almeida, R. Mason, and C. Telesco. Dust in active galactic nuclei. mid-infrared t-ReCS/Gemini spectra using the new RedCan pipeline . A&A , 553 pp. 35, May 2013.
- [gorjian_10_2004] V. Gorjian, M. W. Werner, T. H. Jarrett, D. M. Cole, and M. E. Ressler. 10 micron imaging of seyfert galaxies from the 12 micron sample . ApJ , 605 pp. 156–167, April 2004.
- [horst_mid-infrared_2009] H. Horst, W. J. Duschl, P. Gandhi, and A. Smette. Mid-infrared imaging of 25 local AGN with VLT-VISIR . A&A , 495 pp. 137–146, February 2009.
- [horst_mid_2008] H. Horst, P. Gandhi, A. Smette, and W. J. Duschl. The mid IR - hard x-ray correlation in AGN and its implications for dusty torus models . A&A , 479 pp. 389–396, February 2008.
- [johnson_infrared_2007] Kelsey E. Johnson, John E. Hibbard, Sarah C. Gallagher, Jane C. Charlton, Ann E. Hornschemeier, Thomas H. Jarrett, and Amy E. Reines. The infrared properties of hickson compact groups . AJ , 134 pp. 1522–1543, October 2007.
- [morganti_radio_1999] R. Morganti, Z. I. Tsvetanov, J. Gallimore, and M. G. Allen. Radio continuum morphology of southern seyfert galaxies . A&AS , 137 pp. 457–471, June 1999.
- [noguchi_new_2009] Kazuhisa Noguchi, Yuichi Terashima, and Hisamitsu Awaki. A new sample of buried active galactic nuclei selected from the second XMM-Newton serendipitous source catalogue . ApJ , 705 pp. 454–467, November 2009.
- [ramos_almeida_infrared_2009] C. Ramos Almeida, N. A. Levenson, J. M. Rodríguez Espinosa, A. Alonso-Herrero, A. Asensio Ramos, J. T. Radomski, C. Packham, R. S. Fisher, and C. M. Telesco. The infrared nuclear emission of seyfert galaxies on parsec scales: Testing the clumpy torus models . ApJ , 702 pp. 1127–1149, September 2009.
- [roche_atlas_1991] Patrick F. Roche, David K. Aitken, Craig H. Smith, and Martin J. Ward. An atlas of mid-infrared spectra of galaxy nuclei . MNRAS , 248 pp. 606–629, February 1991.
- [roche_silicate_2007] Patrick F. Roche, Christopher Packham, David K. Aitken, and Rachel E. Mason. Silicate absorption in heavily obscured galaxy nuclei . MNRAS , 375 pp. 99–104, February 2007.
- [sharples_ngc_1984] R. M. Sharples, A. J. Longmore, T. G. Hawarden, and D. Carter. NGC 7172 - an obscured active nucleus . MNRAS , 208 pp. 15–24, May 1984.
- [shi_9.7_2006] Y. Shi, G. H. Rieke, D. C. Hines, V. Gorjian, M. W. Werner, K. Cleary, F. J. Low, P. S. Smith, and J. Bouwman. 9.7 μm silicate features in active galactic nuclei: New insights into unification models . ApJ , 653 pp. 127–136, December 2006.
- [smajic_unveiling_2012] S. Smajić, S. Fischer, J. Zuther, and A. Eckart. Unveiling the nucleus of NGC 7172 . A&A , 544 pp. 105, August 2012.
- [tommasin_spitzer-irs_2010] Silvia Tommasin, Luigi Spinoglio, Matthew A. Malkan, and Giovanni Fazio. Spitzer-IRS high-resolution spectroscopy of the 12 μm seyfert galaxies. II. results for the complete data set . ApJ , 709 pp. 1257–1283, February 2010.
- [unger_radio_1987] S. W. Unger, A. Lawrence, A. S. Wilson, M. Elvis, and A. E. Wright. Radio observations of a hard x-ray selected sample of active galaxies . MNRAS , 228 pp. 521–531, September 1987.
- [veron-cetty_catalogue_2010] M.-P. Véron-Cetty and P. Véron. A catalogue of quasars and active nuclei: 13th edition . A&A , 518 pp. 10, July 2010.
- [ward_continuum_1987] Martin Ward, Martin Elvis, G. Fabbiano, N. P. Carleton, S. P. Willner, and A. Lawrence. The continuum of type 1 seyfert galaxies. i - a single form modified by the effects of dust . ApJ , 315 pp. 74–91, April 1987.
- [wu_spitzer/irs_2009] Yanling Wu, Vassilis Charmandaris, Jiasheng Huang, Luigi Spinoglio, and Silvia Tommasin. Spitzer/IRS 5-35 μm low-resolution spectroscopy of the 12 μm seyfert sample . ApJ , 701 pp. 658–676, August 2009.
Images
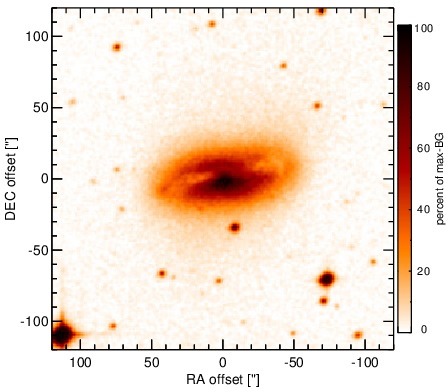
Optical image (DSS, red filter). Displayed are the central 4 arcmin with North being up and East to the left. The colour scaling is linear with white corresponding to the median background (BG) and black to the 0.01% pixels with the highest intensity.
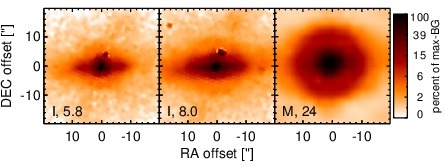
Spitzer MIR images. Displayed are the inner 40 arcsec with North being up and East to the left. The colour scaling is logarithmic with white corresponding to median BG and black to the 0.1% pixels with the highest intensity. The label in the bottom left states instrument and central wavelength of the filter in micron (I: IRAC, M: MIPS).
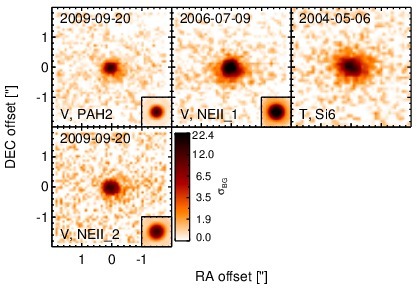
Subarcsecond-resolution MIR images sorted by increasing filter central wavelength. Displayed are the inner 4 arcsec with North being up and East to the left. The colour scaling is logarithmic with white corresponding to median BG and black to the 75% of the highest intensity of all images in units of sig_bg. The inset image (where present; either bottom or top right) shows the central arcsecond of the PSF from the calibrator star, scaled to match the science target. The labels in the bottom left state instrument and filter names (C: COMICS, M: Michelle, T: T-ReCS, V: VISIR).
SEDs
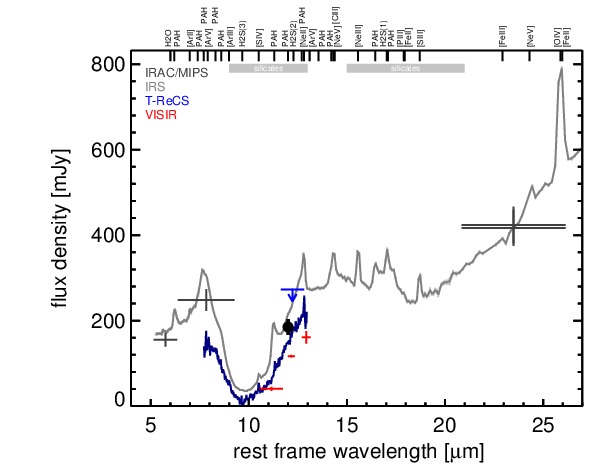
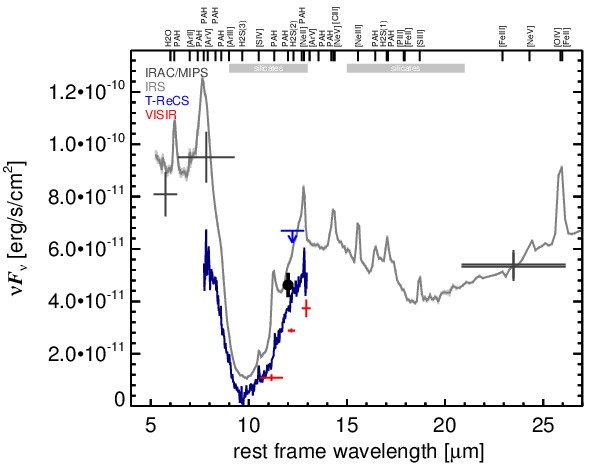
MIR SED. The description of the symbols in all the SED plots (where present) is the following: Grey crosses and solid lines mark the Spitzer/IRAC, MIPS and IRS data. The colour coding of the other symbols is as follows: green for COMICS, magenta for Michelle, blue for T-ReCS and red for VISIR data. Darker-coloured solid lines mark spectra of the corresponding instrument. The black filled circles mark the nuclear 12 and 18 micron continuum emission estimate from the data (where present). The ticks on the top axis mark positions of common MIR emission lines, while the light grey horizontal bars mark wavelength ranges affected by the silicate 10 and 18 micron features.