Sasmirala Individual Information for NGC 7479
Description
NGC 7479 is a low-inclination disturbed barred grand-design spiral galaxy at a redshift of z = 0.0079 (D ~ 30 Mpc), which presumably underwent a recent minor merger [quillen_estimate_1995, laine_minor-merger_1999]. Its nucleus is active and was initially classified as a LINER, then as Sy 1.9 and most recently as Sy 2.0 (see discussion in [trippe_multi-wavelength_2010]). In addition, star formation is reported to occur in the nucleus [martin_star_1997]. At radio wavelengths, the nucleus appears as a compact source with a possible kiloparsec-scale bended jet to the north [ho_radio_2001, laine_radio_2008]. Detected water maser emission is possibly originating in the nucleus [braatz_discovery_2008]. After first being detected in the MIR with IRAS, NGC 7479 was followed up with IRTF [willner_infrared_1985, devereux_spatial_1987, telesco_genesis_1993], AAT/UKIRT [roche_atlas_1991], and Keck/LWS [soifer_high_2004]. The latter observation resulted in the first subarcsecond MIR image, which showed a point-like nucleus. The Spitzer/IRAC and MIPS images are also dominated by compact nuclear emission embedded within bar-like host emission (see also [zhou_star_2011]. The Spitzer/IRS LR staring-mode spectrum exhibits very deep silicate 10 and 18 μm absorption features, no significant PAH emission or atomic forbidden emission lines, and a steep red spectral slope in νFν-space (see also [dartois_carbonaceous_2007, pereira-santaella_mid-infrared_2010]). Therefore, a MIR-dominating, highly-obscured AGN might be present. On the other hand, the absence of any strong MIR emission lines indicates that putative ionized gas is heavily extincted in NGC 7479 (similar to NGC 4945; [perez-beaupuits_deeply_2011]). Its nuclear region was imaged with Michelle in the Si-2 filter in 2008 and an unresolved nucleus without further host emission was detected [mason_nuclear_2012]. In addition, a T-ReCS LR N-band spectrum was obtained [gonzalez-martin_dust_2013], which agrees well with the Spitzer spectrophotometry, exhibiting the same continuum and silicate absorption. The silicate absorption is, thus, produced in the projected central ~ 50 pc. Our nuclear Si-2 photometry is consistent with the value by [mason_nuclear_2012] and the T-ReCS spectrum. Therefore, we use the latter to compute the 12 μm continuum emission estimate corrected for the silicate feature.
- [braatz_discovery_2008] J. A. Braatz and N. E. Gugliucci. The discovery of water maser emission from eight nearby galaxies . ApJ , 678 pp. 96–101, May 2008.
- [dartois_carbonaceous_2007] E. Dartois and G. M. Muñoz-Caro. Carbonaceous dust grains in luminous infrared galaxies. Spitzer/IRS reveals a-C:H as an abundant and ubiquitous ISM component . A&A , 476 pp. 1235–1242, December 2007.
- [devereux_spatial_1987] Nicholas Devereux. The spatial distribution of 10 micron luminosity in spiral galaxies . ApJ , 323 pp. 91–107, December 1987.
- [gonzalez-martin_dust_2013] O. González-Martín, J. M. Rodríguez-Espinosa, T. Díaz-Santos, C. Packham, A. Alonso-Herrero, P. Esquej, C. Ramos Almeida, R. Mason, and C. Telesco. Dust in active galactic nuclei. mid-infrared t-ReCS/Gemini spectra using the new RedCan pipeline . A&A , 553 pp. 35, May 2013.
- [ho_radio_2001] Luis C. Ho and James S. Ulvestad. Radio continuum survey of an optically selected sample of nearby seyfert galaxies . ApJS , 133 pp. 77–118, March 2001.
- [laine_minor-merger_1999] S. Laine and C. H. Heller. A minor-merger model for NGC 7479 . MNRAS , 308 pp. 557–568, September 1999.
- [laine_radio_2008] Seppo Laine and Rainer Beck. Radio continuum jet in NGC 7479 . ApJ , 673 pp. 128–142, January 2008.
- [martin_star_1997] P. Martin and D. Friedli. Star formation in bar environments. i. morphology, star formation rates and general properties. . A&A , 326 pp. 449–464, October 1997.
- [mason_nuclear_2012] R. E. Mason, E. Lopez-Rodriguez, C. Packham, A. Alonso-Herrero, N. A. Levenson, J. Radomski, C. Ramos Almeida, L. Colina, M. Elitzur, I. Aretxaga, P. F. Roche, and N. Oi. The nuclear infrared emission of low-luminosity active galactic nuclei. AJ , 144 pp. 11, July 2012.
- [pereira-santaella_mid-infrared_2010] Miguel Pereira-Santaella, Aleksandar M. Diamond-Stanic, Almudena Alonso-Herrero, and George H. Rieke. The mid-infrared high-ionization lines from active galactic nuclei and star-forming galaxies . ApJ , 725 pp. 2270–2280, December 2010.
- [perez-beaupuits_deeply_2011] J. P. Pérez-Beaupuits, H. W. W. Spoon, M. Spaans, and J. D. Smith. The deeply obscured AGN of NGC 4945. i. spitzer-IRS maps of [ne v], [ne II], h2 0-0 s(1), s(2), and other tracers . A&A , 533 pp. 56, September 2011.
- [quillen_estimate_1995] A. C. Quillen, Jay A. Frogel, Jeffrey D. P. Kenney, R. W. Pogge, and D. L. Depoy. An estimate of the gas inflow rate along the bar in NGC 7479 . ApJ , 441 pp. 549–560, March 1995.
- [roche_atlas_1991] Patrick F. Roche, David K. Aitken, Craig H. Smith, and Martin J. Ward. An atlas of mid-infrared spectra of galaxy nuclei . MNRAS , 248 pp. 606–629, February 1991.
- [soifer_high_2004] B. T. Soifer, G. Neugebauer, K. Matthews, E. Egami, and L. Armus. High spatial resolution mid-infrared observations of five seyfert galaxies . PASP , 116 pp. 493–496, June 2004.
- [telesco_genesis_1993] C. M. Telesco, L. L. Dressel, and R. D. Wolstencroft. The genesis of starbursts and infrared emission in the centers of galaxies . ApJ , 414 pp. 120–143, September 1993.
- [trippe_multi-wavelength_2010] M. L. Trippe, D. M. Crenshaw, R. P. Deo, M. Dietrich, S. B. Kraemer, S. E. Rafter, and T. J. Turner. A multi-wavelength study of the nature of type 1.8/1.9 seyfert galaxies . ApJ , 725 pp. 1749–1767, December 2010.
- [willner_infrared_1985] S. P. Willner, M. Elvis, G. Fabbiano, A. Lawrence, and M. J. Ward. Infrared observations of LINER galactic nuclei . ApJ , 299 pp. 443–461, December 1985.
- [zhou_star_2011] Zhi-Min Zhou, Chen Cao, Xian-Min Meng, and Hong Wu. Star formation properties in barred galaxies (SFB). i. ultraviolet to infrared imaging and spectroscopic studies of NGC 7479 . AJ , 142 pp. 38, August 2011.
Images
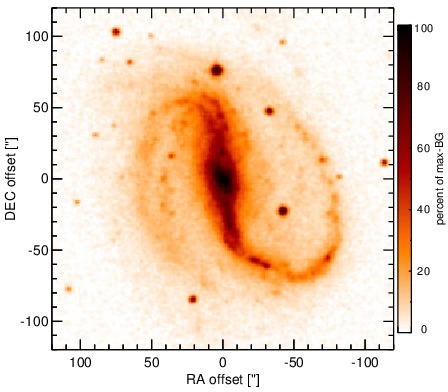
Optical image (DSS, red filter). Displayed are the central 4 arcmin with North being up and East to the left. The colour scaling is linear with white corresponding to the median background (BG) and black to the 0.01% pixels with the highest intensity.
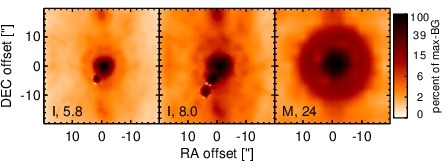
Spitzer MIR images. Displayed are the inner 40 arcsec with North being up and East to the left. The colour scaling is logarithmic with white corresponding to median BG and black to the 0.1% pixels with the highest intensity. The label in the bottom left states instrument and central wavelength of the filter in micron (I: IRAC, M: MIPS).
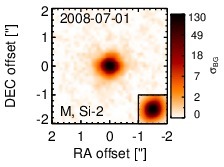
Subarcsecond-resolution MIR images sorted by increasing filter central wavelength. Displayed are the inner 4 arcsec with North being up and East to the left. The colour scaling is logarithmic with white corresponding to median BG and black to the 75% of the highest intensity of all images in units of sig_bg. The inset image (where present; either bottom or top right) shows the central arcsecond of the PSF from the calibrator star, scaled to match the science target. The labels in the bottom left state instrument and filter names (C: COMICS, M: Michelle, T: T-ReCS, V: VISIR).
SEDs
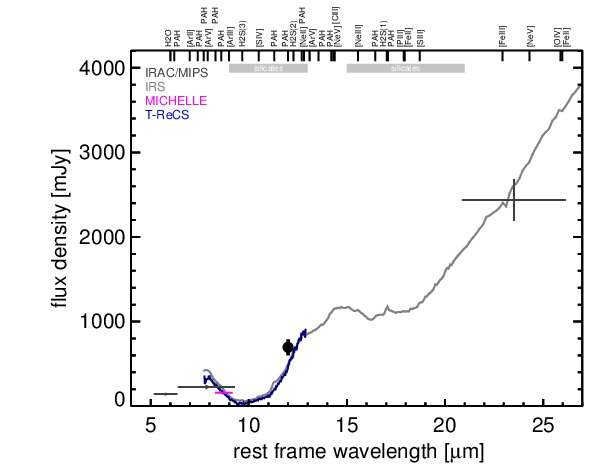
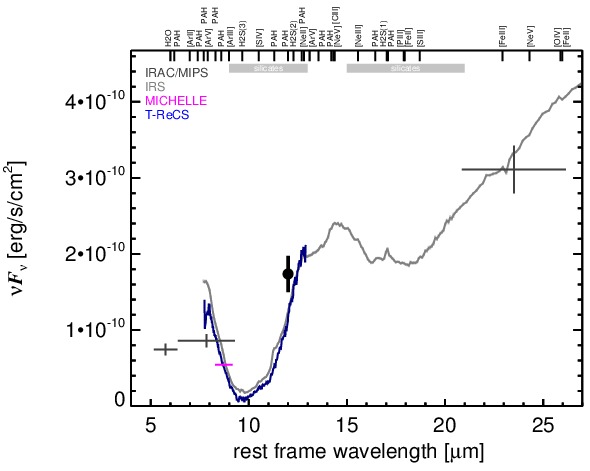
MIR SED. The description of the symbols in all the SED plots (where present) is the following: Grey crosses and solid lines mark the Spitzer/IRAC, MIPS and IRS data. The colour coding of the other symbols is as follows: green for COMICS, magenta for Michelle, blue for T-ReCS and red for VISIR data. Darker-coloured solid lines mark spectra of the corresponding instrument. The black filled circles mark the nuclear 12 and 18 micron continuum emission estimate from the data (where present). The ticks on the top axis mark positions of common MIR emission lines, while the light grey horizontal bars mark wavelength ranges affected by the silicate 10 and 18 micron features.