Sasmirala Individual Information for NGC 7496
Description
NGC 7496 is a low-inclination barred late-type spiral at a redshift of z = 0.0055 (D ~ 2.1 Mpc) with an active nucleus containing both an AGN and a starburst [schmitt_multiwavelength_2006, munoz_marin_atlas_2007]. It has been optically classified as a Sy 2 [veron_how_1981] and H II nucleus [yuan_role_2010], and conclusively is an AGN/starburst composite [veron_agns_1997]. The nucleus is unresolved in arcsecond-resolution radio observations [norris_compact_1990, morganti_radio_1999]. After first being detected in the MIR with IRAS, NGC 7496 was followed up with Spitzer/IRAC, IRS and MIPS observations. The corresponding IRAC and MIPS images show a dominating compact nucleus embedded within the much weak bar and spiral-like host emission. Our nuclear IRAC 5.8 μm photometry agrees with [gallimore_infrared_2010]. On the other hand, our IRAC 8.0 μm value is significantly lower than the published value, yet in better agreement with the IRS LR mapping-mode post-BCD spectrum. The latter exhibits strong PAH emission, no clearly determinable silicate features, and a steep red spectral slope in νFν-space (see also [buchanan_spitzer_2006, wu_spitzer/irs_2009, tommasin_spitzer_2008, tommasin_spitzer-irs_2010, gallimore_infrared_2010]). Thus, the arcsecond-scale MIR SED is significantly affected or even dominated by star-formation emission. The nuclear region of NGC 7496 was observed with T-ReCS in the Si2 and Qa filters in 2010 (unpublished, to our knowledge). In the images, a marginally resolved roundish nucleus was detected (FWHM~ 23% larger than standard star). The unresolved nuclear component fluxes are ~ 45% lower than the Spitzer spectrophotometry. We conclude that star formation dominates over AGN-related MIR emission in NGC 7496 and possible still affects the nuclear MIR SED.
- [buchanan_spitzer_2006] Catherine L. Buchanan, Jack F. Gallimore, Christopher P. O'Dea, Stefi A. Baum, David J. Axon, Andrew Robinson, Moshe Elitzur, and Martin Elvis. Spitzer IRS spectra of a large sample of seyfert galaxies: A variety of infrared spectral energy distributions in the local active galactic nucleus population . AJ , 132 pp. 401–419, July 2006.
- [gallimore_infrared_2010] J. F. Gallimore, A. Yzaguirre, J. Jakoboski, M. J. Stevenosky, D. J. Axon, S. A. Baum, C. L. Buchanan, M. Elitzur, M. Elvis, C. P. O'Dea, and A. Robinson. Infrared spectral energy distributions of seyfert galaxies: Spitzer space telescope observations of the 12 μm sample of active galaxies . ApJS , 187 pp. 172–211, March 2010.
- [morganti_radio_1999] R. Morganti, Z. I. Tsvetanov, J. Gallimore, and M. G. Allen. Radio continuum morphology of southern seyfert galaxies . A&AS , 137 pp. 457–471, June 1999.
- [munoz_marin_atlas_2007] VÍctor M. Muñoz Marín, Rosa M. González Delgado, Henrique R. Schmitt, Roberto Cid Fernandes, Enrique Pérez, Thaisa Storchi-Bergmann, Tim Heckman, and Claus Leitherer. An atlas of the circumnuclear regions of 75 seyfert galaxies in the near-ultraviolet with the hubble space telescope advanced camera for surveys . AJ , 134 pp. 648–667, August 2007.
- [norris_compact_1990] R. P. Norris, M. J. Kesteven, E. R. Troup, D. A. Allen, and R. A. Sramek. Compact radio cores in extremely luminous far-infrared galaxies . ApJ , 359 pp. 291–295, August 1990.
- [schmitt_multiwavelength_2006] H. R. Schmitt, D. Calzetti, L. Armus, M. Giavalisco, T. M. Heckman, R. C. Kennicutt, C. Leitherer, and G. R. Meurer. Multiwavelength star formation indicators: Observations . ApJS , 164 pp. 52–80, May 2006.
- [tommasin_spitzer-irs_2010] Silvia Tommasin, Luigi Spinoglio, Matthew A. Malkan, and Giovanni Fazio. Spitzer-IRS high-resolution spectroscopy of the 12 μm seyfert galaxies. II. results for the complete data set . ApJ , 709 pp. 1257–1283, February 2010.
- [tommasin_spitzer_2008] Silvia Tommasin, Luigi Spinoglio, Matthew A. Malkan, Howard Smith, Eduardo González-Alfonso, and Vassilis Charmandaris. Spitzer IRS high-resolution spectroscopy of the 12 μm seyfert galaxies. i. first results . ApJ , 676 pp. 836–856, April 2008.
- [veron_agns_1997] P. Veron, A. C. Goncalves, and M.-P. Veron-Cetty. AGNs with composite spectra. . A&A , 319 pp. 52–66, March 1997.
- [veron_how_1981] P. Veron, M. P. Veron, J. Bergeron, and E. J. Zuiderwijk. How to find a seyfert nucleus hidden by a normal h II region . A&A , 97 pp. 71–74, April 1981.
- [wu_spitzer/irs_2009] Yanling Wu, Vassilis Charmandaris, Jiasheng Huang, Luigi Spinoglio, and Silvia Tommasin. Spitzer/IRS 5-35 μm low-resolution spectroscopy of the 12 μm seyfert sample . ApJ , 701 pp. 658–676, August 2009.
- [yuan_role_2010] T.-T. Yuan, L. J. Kewley, and D. B. Sanders. The role of starburst-active galactic nucleus composites in luminous infrared galaxy mergers: Insights from the new optical classification scheme . ApJ , 709 pp. 884–911, February 2010.
Images
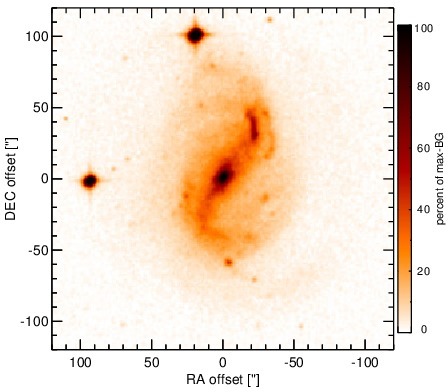
Optical image (DSS, red filter). Displayed are the central 4 arcmin with North being up and East to the left. The colour scaling is linear with white corresponding to the median background (BG) and black to the 0.01% pixels with the highest intensity.
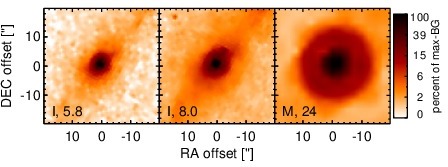
Spitzer MIR images. Displayed are the inner 40 arcsec with North being up and East to the left. The colour scaling is logarithmic with white corresponding to median BG and black to the 0.1% pixels with the highest intensity. The label in the bottom left states instrument and central wavelength of the filter in micron (I: IRAC, M: MIPS).
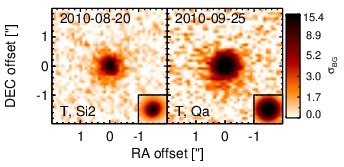
Subarcsecond-resolution MIR images sorted by increasing filter central wavelength. Displayed are the inner 4 arcsec with North being up and East to the left. The colour scaling is logarithmic with white corresponding to median BG and black to the 75% of the highest intensity of all images in units of sig_bg. The inset image (where present; either bottom or top right) shows the central arcsecond of the PSF from the calibrator star, scaled to match the science target. The labels in the bottom left state instrument and filter names (C: COMICS, M: Michelle, T: T-ReCS, V: VISIR).
SEDs
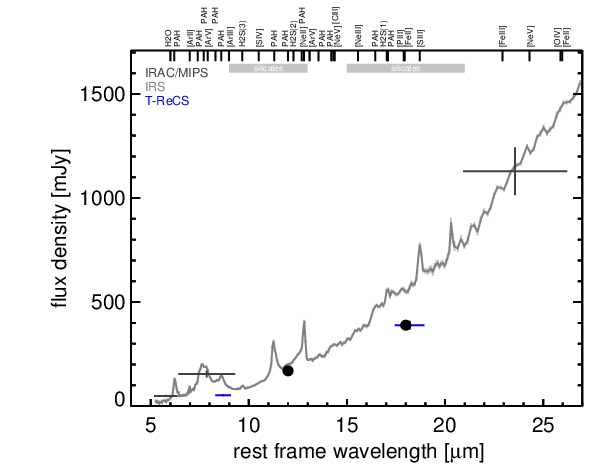
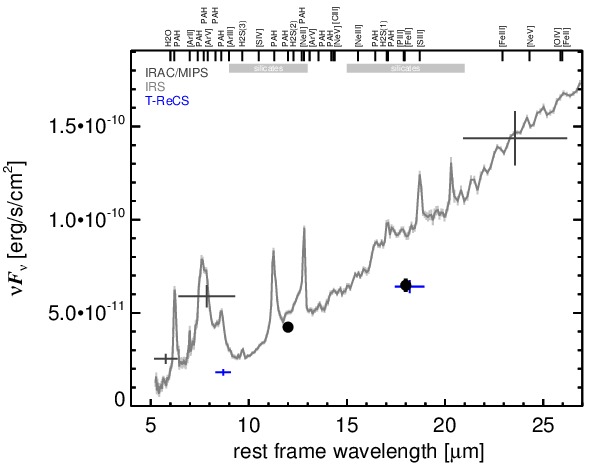
MIR SED. The description of the symbols in all the SED plots (where present) is the following: Grey crosses and solid lines mark the Spitzer/IRAC, MIPS and IRS data. The colour coding of the other symbols is as follows: green for COMICS, magenta for Michelle, blue for T-ReCS and red for VISIR data. Darker-coloured solid lines mark spectra of the corresponding instrument. The black filled circles mark the nuclear 12 and 18 micron continuum emission estimate from the data (where present). The ticks on the top axis mark positions of common MIR emission lines, while the light grey horizontal bars mark wavelength ranges affected by the silicate 10 and 18 micron features.