Sasmirala Individual Information for NGC 7592W
Description
NGC 7592 is an infrared-luminous merger system of two, possibly three, galaxies at a redshift of z = 0.0246 (D ~ 105 Mpc; [hattori_tridimensional_2002]). The two main nuclei are separated by ~ 12arcsec ~ 6kpc in the east-west directions (PA~ 100∘; [rafanelli_complex_1992, dopita_star_2002]). The western, early-type component, NGC 7592W, contains both an AGN and a circum-nuclear starburst [hattori_tridimensional_2002] and is optically classified as a Sy 2/starburst composite. The eastern, late-type, component, NGC 7592E, is apparently a pure starburst [dahari_statistical_1988, rafanelli_complex_1992, hattori_tridimensional_2002]. The detection of a compact hard-X-ray and radio source verifies the presence of an AGN in NGC 7592W [wang_chandra_2010, lonsdale_vlbi_1992]. Furthermore, bipolar kiloparsec-scale ionization cones have been reported in NGC 7592W (PA~ 160∘; [hattori_tridimensional_2002]). After first being detected in the MIR with IRAS, NGC 7592 was followed up with Palomar 5 m bolometer MIR photometry of both main nuclei [carico_iras_1988], ISO MIR [hwang_mid-infrared_1999, clavel_2.5-11_2000, ramos_almeida_mid-infrared_2007] and Spitzer/IRAC, IRS and MIPS observations. In the corresponding IRAC and MIPS images, NGC 7592W appears as a compact source dominating the MIR emission of the system, while NGC 7592E appears elongated without a clearly separable unresolved nuclear component. Our nuclear MIPS 24 μm photometry of the unresolved core of NGC 7592W is affected by blending emission from NGC 7592E and, thus, should be treated as an upper limit. The IRS LR mapping-mode spectrum of NGC 7592W exhibits silicate 10 μm absorption, prominent PAH emission, and a red spectral slope in νFν-space (see also [stierwalt_mid-infrared_2013]). Thus, the arcsecond-scale MIR SED indicates the composition of obscured AGN and starburst emission. NGC 7592 was imaged with T-ReCS in the Qa filter in 2010 [imanishi_subaru_2011]. Only NGC 7592W was detected in the image and appears as a possibly resolved nucleus (FWHM(major axis)~ 0.71arcsec ~ 0.4 kpc; PA~ 85∘) without further host emission. However, the current subarcsecond MIR data are insufficient to reach any robust conclusion about the nuclear extension at subarcsecond scales in the MIR. Our nuclear Qa photometry is ~ 18% lower than the value published in [imanishi_subaru_2011] and also ~ 25% lower than the Spitzer spectrophotometry. Therefore, we extrapolate from the Qa measurement towards shorter wavelengths in order to compute the nuclear 12 μm continuum emission estimate as described in Sect. 4.3.
- [carico_iras_1988] David P. Carico, D. B. Sanders, B. T. Soifer, J. H. Elias, K. Matthews, and G. Neugebauer. The IRAS bright galaxy sample. III - 1-10 micron observations and coadded IRAS data for galaxies with l(IR) equal to or greater than 10 to the 11th solar luminosities . AJ , 95 pp. 356–373, February 1988.
- [clavel_2.5-11_2000] J. Clavel, B. Schulz, B. Altieri, P. Barr, P. Claes, A. Heras, K. Leech, L. Metcalfe, and A. Salama. 2.5-11 micron spectroscopy and imaging of AGNs. implication for unification schemes . A&A , 357 pp. 839–849, May 2000.
- [dahari_statistical_1988] Oved Dahari and Michael M. De Robertis. A statistical study of properties of seyfert and starburst galaxies . ApJS , 67 pp. 249–277, July 1988.
- [dopita_star_2002] M. A. Dopita, M. Pereira, L. J. Kewley, and M. Capaccioli. Star formation rates in interacting starburst galaxies . ApJS , 143 pp. 47–72, November 2002.
- [hattori_tridimensional_2002] Takashi Hattori, Michitoshi Yoshida, Hiroshi Ohtani, Tsuyoshi Ishigaki, Hajime Sugai, Tadashi Hayashi, Shinobu Ozaki, and Motomi Ishii. Tridimensional spectroscopic observation of the interacting system NGC 7592 . PASJ , 54 pp. 393–404, June 2002.
- [hwang_mid-infrared_1999] Chorng-Yuan Hwang, K. Y. Lo, Yu Gao, Robert A. Gruendl, and Nanyao Y. Lu. Mid-infrared images of luminous infrared galaxies in a merging sequence . ApJL , 511 pp. L17–L20, January 1999.
- [imanishi_subaru_2011] Masatoshi Imanishi, Keisuke Imase, Nagisa Oi, and Kohei Ichikawa. Subaru and gemini high spatial resolution infrared 18 μm imaging observations of nearby luminous infrared galaxies . AJ , 141 pp. 156, May 2011.
- [lonsdale_vlbi_1992] Colin J. Lonsdale, Carol J. Lonsdale, and Harding E. Smith. A VLBI search for AGN radio cores in starburst galaxies . ApJ , 391 pp. 629–650, June 1992.
- [rafanelli_complex_1992] Piero Rafanelli and Paolo Marziani. The complex nature of the interacting system NGC 7592 . AJ , 103 pp. 743–756, March 1992.
- [ramos_almeida_mid-infrared_2007] C. Ramos Almeida, A. M. Pérez García, J. A. Acosta-Pulido, and J. M. Rodríguez Espinosa. The mid-infrared emission of seyfert galaxies: A new analysis of ISOCAM data . AJ , 134 pp. 2006–2019, November 2007.
- [stierwalt_mid-infrared_2013] S. Stierwalt, L. Armus, J. A. Surace, H. Inami, A. O. Petric, T. Diaz-Santos, S. Haan, V. Charmandaris, J. Howell, D. C. Kim, J. Marshall, J. M. Mazzarella, H. W. W. Spoon, S. Veilleux, A. Evans, D. B. Sanders, P. Appleton, G. Bothun, C. R. Bridge, B. Chan, D. Frayer, K. Iwasawa, L. J. Kewley, S. Lord, B. F. Madore, J. E. Melbourne, E. J. Murphy, J. A. Rich, B. Schulz, E. Sturm, V. U, T. Vavilkin, and K. Xu. Mid-infrared properties of nearby luminous infrared galaxies. i. spitzer infrared spectrograph spectra for the GOALS sample . ApJS , 206 pp. 1, May 2013.
- [wang_chandra_2010] Jing-Bo Wang and Yu Gao. Chandra archival study of (U)LIRGs with a double nucleus: binary AGNs? . Research in A&A , 10 pp. 309–328, April 2010.
Images
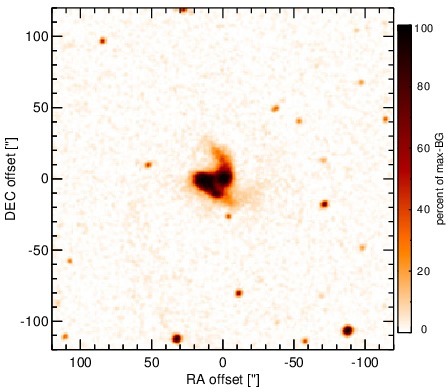
Optical image (DSS, red filter). Displayed are the central 4 arcmin with North being up and East to the left. The colour scaling is linear with white corresponding to the median background (BG) and black to the 0.01% pixels with the highest intensity.
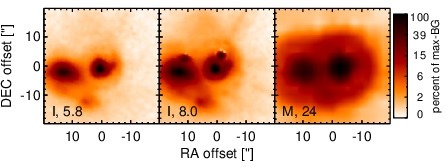
Spitzer MIR images. Displayed are the inner 40 arcsec with North being up and East to the left. The colour scaling is logarithmic with white corresponding to median BG and black to the 0.1% pixels with the highest intensity. The label in the bottom left states instrument and central wavelength of the filter in micron (I: IRAC, M: MIPS).
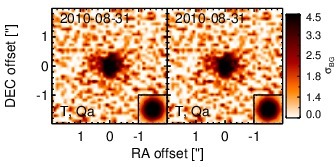
Subarcsecond-resolution MIR images sorted by increasing filter central wavelength. Displayed are the inner 4 arcsec with North being up and East to the left. The colour scaling is logarithmic with white corresponding to median BG and black to the 75% of the highest intensity of all images in units of sig_bg. The inset image (where present; either bottom or top right) shows the central arcsecond of the PSF from the calibrator star, scaled to match the science target. The labels in the bottom left state instrument and filter names (C: COMICS, M: Michelle, T: T-ReCS, V: VISIR).
SEDs
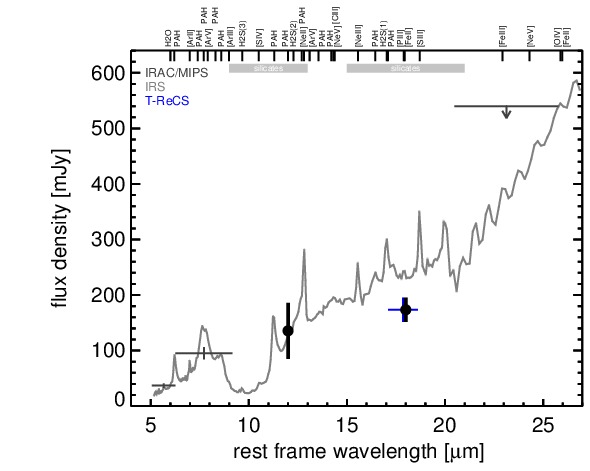
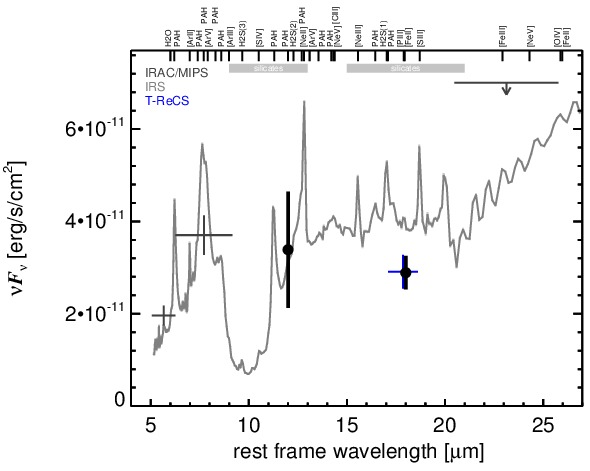
MIR SED. The description of the symbols in all the SED plots (where present) is the following: Grey crosses and solid lines mark the Spitzer/IRAC, MIPS and IRS data. The colour coding of the other symbols is as follows: green for COMICS, magenta for Michelle, blue for T-ReCS and red for VISIR data. Darker-coloured solid lines mark spectra of the corresponding instrument. The black filled circles mark the nuclear 12 and 18 micron continuum emission estimate from the data (where present). The ticks on the top axis mark positions of common MIR emission lines, while the light grey horizontal bars mark wavelength ranges affected by the silicate 10 and 18 micron features.