Sasmirala Individual Information for NGC 7679
Description
NGC 7679 is an infrared-luminous, low-inclination peculiar barred spiral galaxy at a redshift of z = 0.0171 (D ~ 71.7 Mpc), forming a wide pair with NGC 7682 ~ 4.5arcmimin to the east (Arp 216). It was initially classified as a LINER/H II transition object [dahari_nuclear_1985] and contains both a circum-nuclear and a nuclear starburst, as well as an AGN [pogge_star_1993, gu_nuclear_2001, buson_ngc_2006]. The AGN was later optically classified either as Sy 1.9 or Sy 2 nucleus [veron-cetty_catalogue_2010, veilleux_optical_1995]. Following [kewley_optical_2001] and [buson_ngc_2006], we treat the nucleus as AGN/starburst composite. Interestingly, the AGN appears unabsorbed in X-rays [della_ceca_unveiling_2001], which is very atypical for an AGN/starburst composite object. A compact radio core embedded within extended clumpy emission [parra_cola._2010] and kiloparsec-scale extended [O III] emission have been detected (PA~ 80∘; [yankulova_luminous_2007]). After its identification as an infrared-luminous galaxy with IRAS, NGC 7679 was followed up in the MIR with IRTF [telesco_genesis_1993] and Spitzer/IRAC, IRS and MIPS. The corresponding IRAC and MIPS images show an extended, elongated bright nucleus embedded within much fainter host emission (major axis diameter ~ 8arcsec ~ 3 kpc; PA~ 120∘). The IRS spectrum is dominated by strong PAH emission and has a steep red spectral slope in the N-band in νFν-space, while the silicate features appear to be weak if present at all (see also [shi_unobscured_2010, stierwalt_mid-infrared_2013]). The arcsecond-scale MIR SED appears to be completely star-formation dominated. We imaged NGC 7679 with VISIR in three narrow N-band filters in 2006 [horst_mid_2008, horst_mid-infrared_2009] and weakly detected a compact nucleus without further extended emission. The nucleus appears marginally resolved in the PAH2 image but not in the sharper SIV filter. Therefore, we classify the general MIR extension of the nucleus at subarcsecond resolution as uncertain. Deeper MIR imaging is required. Our new photometry optimized for faint detections results in marginally consistent values with [horst_mid_2008]. The corresponding nuclear MIR SED is 75% lower than the Spitzer spectrophotometry, verifying that star formation is indeed dominating the MIR emission of NGC 7679. Furthermore, the nuclear MIR SED indicates PAH 11.3 μm emission and is likely still containing star-formation emission.
- [buson_ngc_2006] L. M. Buson, M. Cappellari, E. M. Corsini, E. V. Held, J. Lim, and A. Pizzella. NGC 7679: an anomalous, composite seyfert 1 galaxy whose x-ray luminous AGN vanishes at optical wavelengths . A&A , 447 pp. 441–451, February 2006.
- [dahari_nuclear_1985] O. Dahari. The nuclear activity of interacting galaxies . ApJS , 57 pp. 643–664, April 1985.
- [della_ceca_unveiling_2001] R. Della Ceca, S. Pellegrini, L. Bassani, V. Beckmann, M. Cappi, G. G. C. Palumbo, G. Trinchieri, and A. Wolter. Unveiling the AGN powering the ``Composite" Seyfert/Star-forming galaxy NGC 7679: BeppoSAX and ASCA results . A&A , 375 pp. 781–790, September 2001.
- [gu_nuclear_2001] Q. S. Gu, J. H. Huang, J. A. de Diego, D. Dultzin-Hacyan, S. J. Lei, and E. Benítez. The nuclear starburst activity in the seyfert 2 galaxy NGC 7679 . A&A , 374 pp. 932–935, August 2001.
- [horst_mid-infrared_2009] H. Horst, W. J. Duschl, P. Gandhi, and A. Smette. Mid-infrared imaging of 25 local AGN with VLT-VISIR . A&A , 495 pp. 137–146, February 2009.
- [horst_mid_2008] H. Horst, P. Gandhi, A. Smette, and W. J. Duschl. The mid IR - hard x-ray correlation in AGN and its implications for dusty torus models . A&A , 479 pp. 389–396, February 2008.
- [kewley_optical_2001] L. J. Kewley, C. A. Heisler, M. A. Dopita, and S. Lumsden. Optical classification of southern warm infrared galaxies . ApJS , 132 pp. 37–71, January 2001.
- [parra_cola._2010] R. Parra, J. E. Conway, S. Aalto, P. N. Appleton, R. P. Norris, Y. M. Pihlström, and L. J. Kewley. COLA. III. radio detection of active galactic nucleus in compact moderate luminosity infrared galaxies . ApJ , 720 pp. 555–568, September 2010.
- [pogge_star_1993] Richard W. Pogge and Paul B. Eskridge. Star formation in the disks of h i-rich s0 galaxies . AJ , 106 pp. 1405–1419, October 1993.
- [shi_unobscured_2010] Yong Shi, George H. Rieke, Paul Smith, Jane Rigby, Dean Hines, Jennifer Donley, Gary Schmidt, and Aleksandar M. Diamond-Stanic. Unobscured type 2 active galactic nuclei . ApJ , 714 pp. 115–129, May 2010.
- [stierwalt_mid-infrared_2013] S. Stierwalt, L. Armus, J. A. Surace, H. Inami, A. O. Petric, T. Diaz-Santos, S. Haan, V. Charmandaris, J. Howell, D. C. Kim, J. Marshall, J. M. Mazzarella, H. W. W. Spoon, S. Veilleux, A. Evans, D. B. Sanders, P. Appleton, G. Bothun, C. R. Bridge, B. Chan, D. Frayer, K. Iwasawa, L. J. Kewley, S. Lord, B. F. Madore, J. E. Melbourne, E. J. Murphy, J. A. Rich, B. Schulz, E. Sturm, V. U, T. Vavilkin, and K. Xu. Mid-infrared properties of nearby luminous infrared galaxies. i. spitzer infrared spectrograph spectra for the GOALS sample . ApJS , 206 pp. 1, May 2013.
- [telesco_genesis_1993] C. M. Telesco, L. L. Dressel, and R. D. Wolstencroft. The genesis of starbursts and infrared emission in the centers of galaxies . ApJ , 414 pp. 120–143, September 1993.
- [veilleux_optical_1995] S. Veilleux, D.-C. Kim, D. B. Sanders, J. M. Mazzarella, and B. T. Soifer. Optical spectroscopy of luminous infrared galaxies. II. analysis of the nuclear and long-slit data . ApJS , 98 pp. 171, May 1995.
- [veron-cetty_catalogue_2010] M.-P. Véron-Cetty and P. Véron. A catalogue of quasars and active nuclei: 13th edition . A&A , 518 pp. 10, July 2010.
- [yankulova_luminous_2007] I. M. Yankulova, V. K. Golev, and K. Jockers. The luminous infrared composite seyfert 2 galaxy NGC 7679 through the [o III] λ 5007 emission line . A&A , 469 pp. 891–898, July 2007.
Images
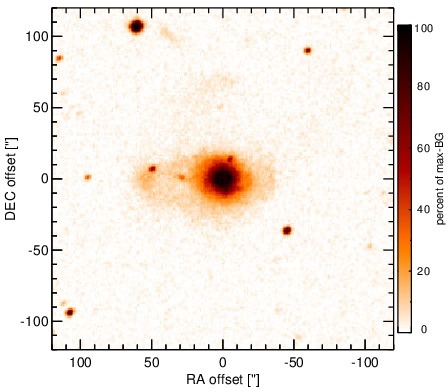
Optical image (DSS, red filter). Displayed are the central 4 arcmin with North being up and East to the left. The colour scaling is linear with white corresponding to the median background (BG) and black to the 0.01% pixels with the highest intensity.
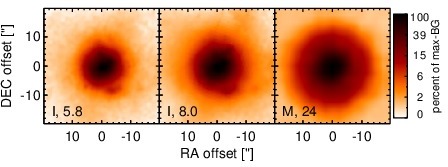
Spitzer MIR images. Displayed are the inner 40 arcsec with North being up and East to the left. The colour scaling is logarithmic with white corresponding to median BG and black to the 0.1% pixels with the highest intensity. The label in the bottom left states instrument and central wavelength of the filter in micron (I: IRAC, M: MIPS).
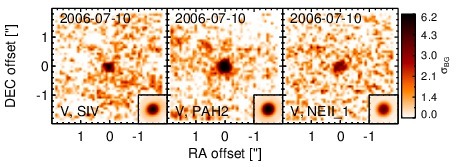
Subarcsecond-resolution MIR images sorted by increasing filter central wavelength. Displayed are the inner 4 arcsec with North being up and East to the left. The colour scaling is logarithmic with white corresponding to median BG and black to the 75% of the highest intensity of all images in units of sig_bg. The inset image (where present; either bottom or top right) shows the central arcsecond of the PSF from the calibrator star, scaled to match the science target. The labels in the bottom left state instrument and filter names (C: COMICS, M: Michelle, T: T-ReCS, V: VISIR).
SEDs
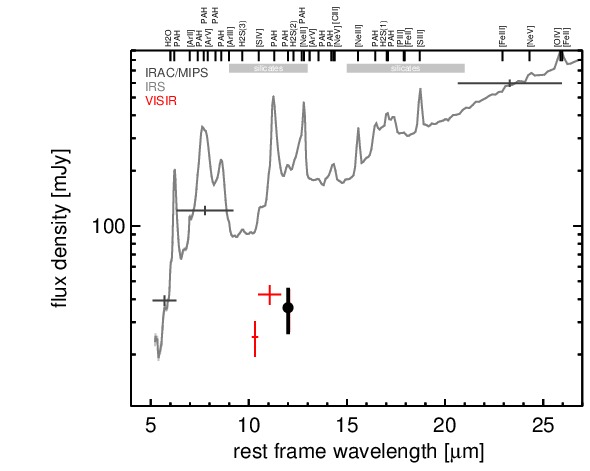
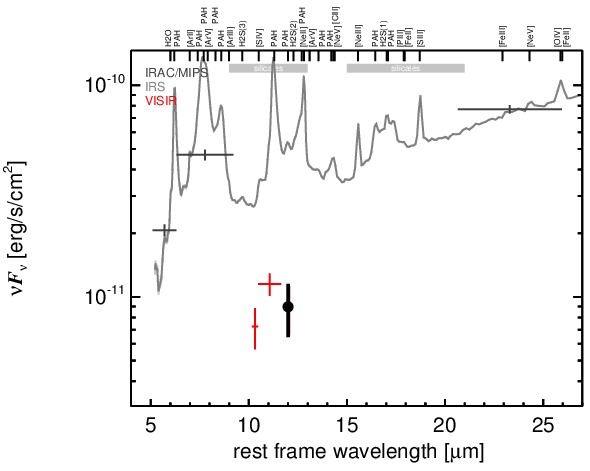
MIR SED. The description of the symbols in all the SED plots (where present) is the following: Grey crosses and solid lines mark the Spitzer/IRAC, MIPS and IRS data. The colour coding of the other symbols is as follows: green for COMICS, magenta for Michelle, blue for T-ReCS and red for VISIR data. Darker-coloured solid lines mark spectra of the corresponding instrument. The black filled circles mark the nuclear 12 and 18 micron continuum emission estimate from the data (where present). The ticks on the top axis mark positions of common MIR emission lines, while the light grey horizontal bars mark wavelength ranges affected by the silicate 10 and 18 micron features.