Sasmirala Individual Information for PG 2130+099
Description
PG 2130+099 is a borderline quasar/Seyfert object at a redshift of z = 0.063 (D~ 288 Mpc) with an optical classification as Sy 1.5 [veron-cetty_catalogue_2010] in a highly-inclined peculiar spiral host galaxy. At radio wavelengths, it appears as a compact radio core with two off-nuclear compact sources at ~ 1arcsec ~ 1.2 kpc to the south-east and ~ 1.5arcsec ~ 1.8 kpc to the north-west (PA~ 135∘;[kukula_radio_1998, leipski_radio_2006]). Pioneering MIR observations of PG 2130+099 were performed by [rieke_infrared_1978], followed by [neugebauer_continuum_1987], [elvis_atlas_1994], [neugebauer_variability_1999], and [galliano_mid-infrared_2005]. The latter authors report the first subarcsecond-resolution MIR observations, in which PG 2130+099 appears unresolved. This object was also observed with ISO [rigopoulou_large_1999, haas_iso_2003] and Spitzer/IRS and MIPS, and appears point-like in the corresponding MIPS 24 μm image. The IRS LR staring-mode spectrum exhibits weak silicate 10 and 18 μm emission, very weak PAH features and a very shallow blue spectral slope in νFν-space (see also [shi_aromatic_2007]). We observed PG 2130+099 with VISIR in three narrow N-band filters in 2005 [horst_small_2006, horst_mid-infrared_2009], and an additional COMICS image in the N11.7 filter was taken in 2006 [imanishi_subaru_2011]. A compact nucleus without further host emission was detected in all cases. The nuclear morphology is inconsistent between the VISIR and COMICS images, and we classify its MIR extension at subarcsecond resolution as uncertain. Our nuclear photometry is consistent with [horst_small_2006], 32% higher than the value from [imanishi_subaru_2011], and consistent with, yet systematically higher than, the Spitzer spectrophotometry. Comparison with the historical N-band photometry shows apparent flux variations on the order of ~ 6% during the last ~ 30 years, well within the uncertainties and systematics due to different instruments, filters and measurement methods.
- [elvis_atlas_1994] Martin Elvis, Belinda J. Wilkes, Jonathan C. McDowell, Richard F. Green, Jill Bechtold, S. P. Willner, M. S. Oey, Elisha Polomski, and Roc Cutri. Atlas of quasar energy distributions . ApJS , 95 pp. 1–68, November 1994.
- [galliano_mid-infrared_2005] E. Galliano, D. Alloin, E. Pantin, P. O. Lagage, and O. Marco. Mid-infrared imaging of active galaxies. active nuclei and embedded star clusters . A&A , 438 pp. 803–820, August 2005.
- [haas_iso_2003] M. Haas, U. Klaas, S. A. H. Müller, F. Bertoldi, M. Camenzind, R. Chini, O. Krause, D. Lemke, K. Meisenheimer, P. J. Richards, and B. J. Wilkes. The ISO view of palomar-green quasars . A&A , 402 pp. 87–111, April 2003.
- [horst_mid-infrared_2009] H. Horst, W. J. Duschl, P. Gandhi, and A. Smette. Mid-infrared imaging of 25 local AGN with VLT-VISIR . A&A , 495 pp. 137–146, February 2009.
- [horst_small_2006] H. Horst, A. Smette, P. Gandhi, and W. J. Duschl. The small dispersion of the mid IR - hard x-ray correlation in active galactic nuclei . A&A , 457 pp. L17–L20, October 2006.
- [imanishi_subaru_2011] Masatoshi Imanishi, Keisuke Imase, Nagisa Oi, and Kohei Ichikawa. Subaru and gemini high spatial resolution infrared 18 μm imaging observations of nearby luminous infrared galaxies . AJ , 141 pp. 156, May 2011.
- [kukula_radio_1998] Marek J. Kukula, James S. Dunlop, David H. Hughes, and Steve Rawlings. The radio properties of radio-quiet quasars . MNRAS , 297 pp. 366–382, June 1998.
- [leipski_radio_2006] C. Leipski, H. Falcke, N. Bennert, and S. Hüttemeister. The radio structure of radio-quiet quasars . A&A , 455 pp. 161–172, August 2006.
- [neugebauer_continuum_1987] G. Neugebauer, R. F. Green, K. Matthews, M. Schmidt, B. T. Soifer, and J. Bennett. Continuum energy distributions of quasars in the palomar-green survey . ApJS , 63 pp. 615–644, March 1987.
- [neugebauer_variability_1999] G. Neugebauer and K. Matthews. Variability of quasars at 10 microns . AJ , 118 pp. 35–45, July 1999.
- [rieke_infrared_1978] G. H. Rieke. The infrared emission of seyfert galaxies . ApJ , 226 pp. 550–558, December 1978.
- [rigopoulou_large_1999] D. Rigopoulou, H. W. W. Spoon, R. Genzel, D. Lutz, A. F. M. Moorwood, and Q. D. Tran. A large mid-infrared spectroscopic and near-infrared imaging survey of ultraluminous infrared galaxies: Their nature and evolution . AJ , 118 pp. 2625–2645, December 1999.
- [shi_aromatic_2007] Yong Shi, Patrick Ogle, George H. Rieke, Robert Antonucci, Dean C. Hines, Paul S. Smith, Frank J. Low, Jeroen Bouwman, and Christopher Willmer. Aromatic features in AGNs: star-forming infrared luminosity function of AGN host galaxies . ApJ , 669 pp. 841–861, November 2007.
- [veron-cetty_catalogue_2010] M.-P. Véron-Cetty and P. Véron. A catalogue of quasars and active nuclei: 13th edition . A&A , 518 pp. 10, July 2010.
Images
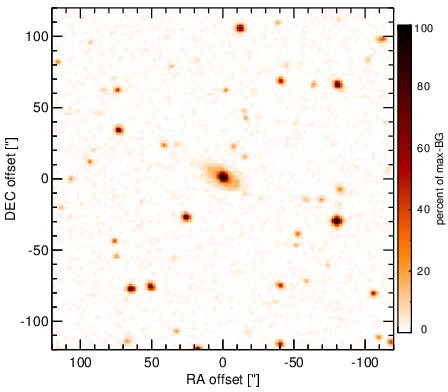
Optical image (DSS, red filter). Displayed are the central 4 arcmin with North being up and East to the left. The colour scaling is linear with white corresponding to the median background (BG) and black to the 0.01% pixels with the highest intensity.
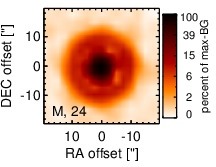
Spitzer MIR images. Displayed are the inner 40 arcsec with North being up and East to the left. The colour scaling is logarithmic with white corresponding to median BG and black to the 0.1% pixels with the highest intensity. The label in the bottom left states instrument and central wavelength of the filter in micron (I: IRAC, M: MIPS).
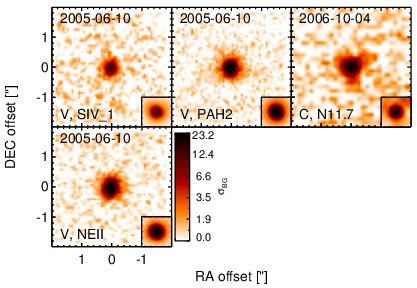
Subarcsecond-resolution MIR images sorted by increasing filter central wavelength. Displayed are the inner 4 arcsec with North being up and East to the left. The colour scaling is logarithmic with white corresponding to median BG and black to the 75% of the highest intensity of all images in units of sig_bg. The inset image (where present; either bottom or top right) shows the central arcsecond of the PSF from the calibrator star, scaled to match the science target. The labels in the bottom left state instrument and filter names (C: COMICS, M: Michelle, T: T-ReCS, V: VISIR).
SEDs
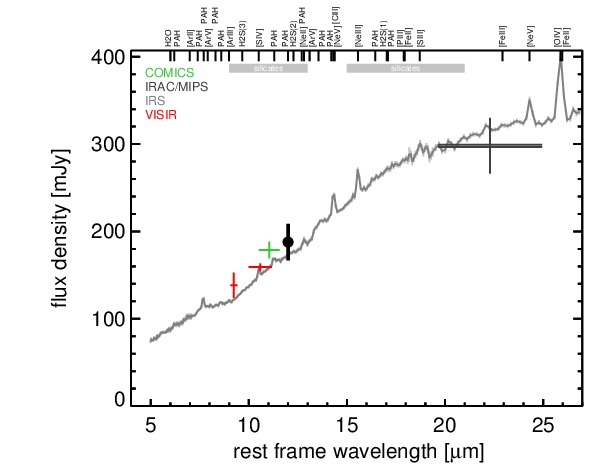
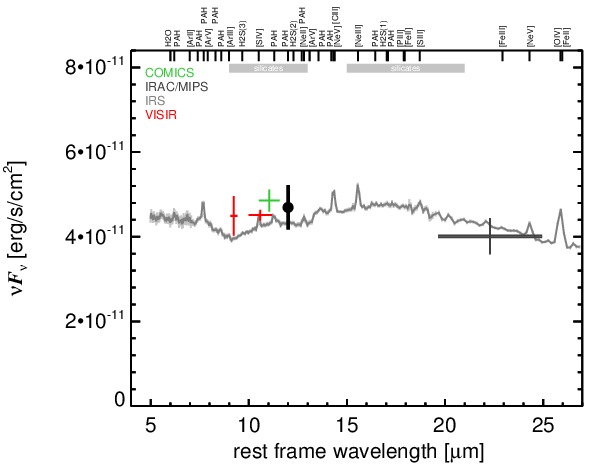
MIR SED. The description of the symbols in all the SED plots (where present) is the following: Grey crosses and solid lines mark the Spitzer/IRAC, MIPS and IRS data. The colour coding of the other symbols is as follows: green for COMICS, magenta for Michelle, blue for T-ReCS and red for VISIR data. Darker-coloured solid lines mark spectra of the corresponding instrument. The black filled circles mark the nuclear 12 and 18 micron continuum emission estimate from the data (where present). The ticks on the top axis mark positions of common MIR emission lines, while the light grey horizontal bars mark wavelength ranges affected by the silicate 10 and 18 micron features.