Sasmirala Individual Information for PKS 1932-46
Description
PKS 1932-46 is an FR II radio source in an elliptical galaxy at a redshift of z = 0.2307 (D ~ 1191 Mpc) with a Sy 1.9 nucleus [veron-cetty_catalogue_2010]. The galaxy has a disturbed optical morphology, presumably caused by a past merger or the close-by star-forming companion galaxy [villar-martin_giant_2005, inskip_pks1932-46:_2007]. PKS 1932-46 features a galactic-scale extended emission line region, which is just partly belonging to the AGN ionization cone, and extended double-lobe radio emission along a PA~-72∘ [villar-martin_pks_1998, villar-martin_giant_2005]. The first MIR detection of this object was achieved with Spitzer/MIPS where it appears as a compact nucleus embedded within extended emission coinciding with the radio extension [inskip_pks1932-46:_2007]. Our nuclear MIPS 24 μm photometry is consistent with the latter work. The Spitzer/IRS LR staring-mode spectrum suffers from very low S/N but indicates PAH and possibly silicate emission and a flat spectral slope in νFν-space. The arcsecond-scale MIR SED might, thus, be affected by star-formation emission. PKS 1932-46 was observed with VISIR in the broad SIC filter in 2010 (unpublished, to our knowledge), but no emission source could be detected. The corresponding flux upper limit is much less stringent than the Spitzer spectrophotometry, which is why we us the latter to derive an upper limit on any AGN-caused 12 μm continuum emission.
- [inskip_pks1932-46:_2007] K. J. Inskip, C. N. Tadhunter, D. Dicken, J. Holt, M. Villar-Martín, and R. Morganti. PKS1932-46: a radio source in an interacting group? . MNRAS , 382 pp. 95–108, November 2007.
- [veron-cetty_catalogue_2010] M.-P. Véron-Cetty and P. Véron. A catalogue of quasars and active nuclei: 13th edition . A&A , 518 pp. 10, July 2010.
- [villar-martin_giant_2005] M. Villar-Martín, C. Tadhunter, R. Morganti, and J. Holt. The giant star forming halo associated with the radio galaxy PKS 1932-46 . MNRAS , 359 pp. L5–L9, May 2005.
- [villar-martin_pks_1998] M. Villar-Martin, C. Tadhunter, R. Morganti, N. Clark, N. Killeen, and D. Axon. PKS 1932-464: a jet-cloud interaction in a radio galaxy? . A&A , 332 pp. 479–492, April 1998.
Images
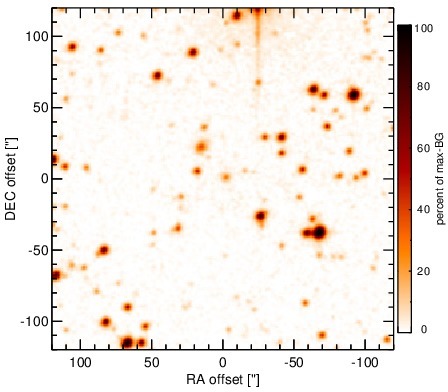
Optical image (DSS, red filter). Displayed are the central 4 arcmin with North being up and East to the left. The colour scaling is linear with white corresponding to the median background (BG) and black to the 0.01% pixels with the highest intensity.
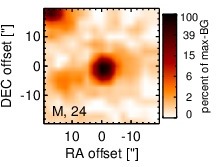
Spitzer MIR images. Displayed are the inner 40 arcsec with North being up and East to the left. The colour scaling is logarithmic with white corresponding to median BG and black to the 0.1% pixels with the highest intensity. The label in the bottom left states instrument and central wavelength of the filter in micron (I: IRAC, M: MIPS).
SEDs
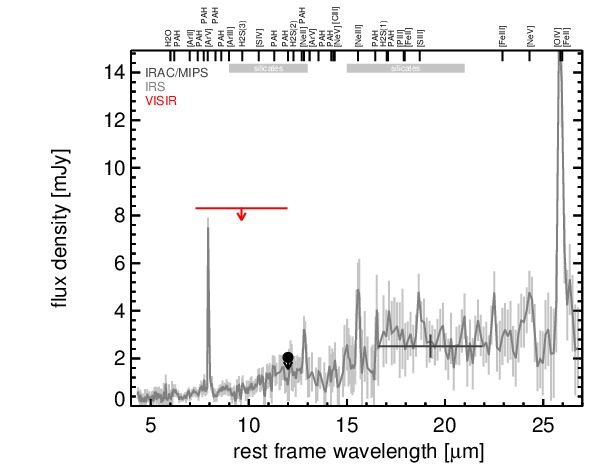
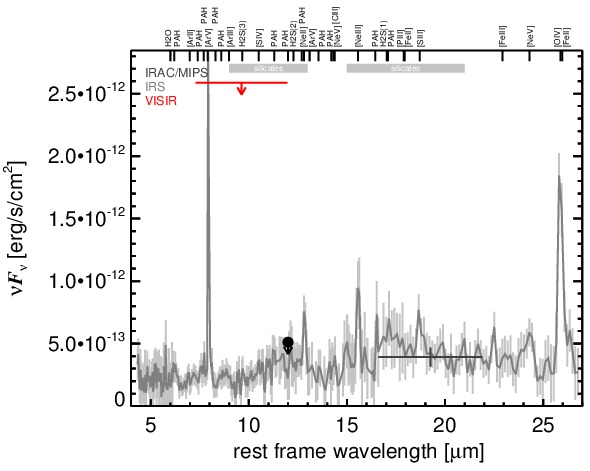
MIR SED. The description of the symbols in all the SED plots (where present) is the following: Grey crosses and solid lines mark the Spitzer/IRAC, MIPS and IRS data. The colour coding of the other symbols is as follows: green for COMICS, magenta for Michelle, blue for T-ReCS and red for VISIR data. Darker-coloured solid lines mark spectra of the corresponding instrument. The black filled circles mark the nuclear 12 and 18 micron continuum emission estimate from the data (where present). The ticks on the top axis mark positions of common MIR emission lines, while the light grey horizontal bars mark wavelength ranges affected by the silicate 10 and 18 micron features.