Sasmirala Individual Information for PKS 2354-35
Description
PKS 2354-35 is an ultra-steep spectrum FR I radio source identified with the elliptical galaxy ESO 349-10 at a redshift of z = 0.0491 (D ~ 222 Mpc). It contains an optical LINER-type nucleus [veron-cetty_catalogue_2010]. It was observed with Spitzer/IRAC and MIPS and appears as a compact nuclear source embedded within diffuse host emission in the IRAC 5.8 and 8.0 μm images, while only a weak point source was detected in the MIPS 24 μm image. The latter image is affected by artefacts, which appear as extended boxy emission south-west of the nucleus. The Spitzer images have also been analysed in [quillen_infrared_2008] who find significantly higher fluxes than we do for the nuclear point source. The cause for this discrepancy is probably related to the intrinsic faintness of the object and the different flux measurement methods. One narrow N-band filter image of PKS 2354-35 was taken in 2006 with VISIR [van_der_wolk_dust_2010]. As expected from the milli-Jansky fluxes found by Spitzer, the source has not been detected. Therefore, we use the Spitzer photometry to derive an upper limit for the 12 μm continuum flux, which is ~ 3 times lower than our upper limit obtained from the VISIR photometry.
- [quillen_infrared_2008] Alice C. Quillen, Nicholas Zufelt, Jaehong Park, Christopher P. O'Dea, Stefi A. Baum, George Privon, Jacob Noel-Storr, Alastair Edge, Helen Russell, Andy Fabian, Megan Donahue, Joel N. Bregman, Brian R. McNamara, and Craig L. Sarazin. An infrared survey of brightest cluster galaxies. i. . ApJS , 176 pp. 39–58, May 2008.
- [van_der_wolk_dust_2010] G. van der Wolk, P. D. Barthel, R. F. Peletier, and J. W. Pel. Dust tori in radio galaxies . A&A , 511 pp. 64, February 2010.
- [veron-cetty_catalogue_2010] M.-P. Véron-Cetty and P. Véron. A catalogue of quasars and active nuclei: 13th edition . A&A , 518 pp. 10, July 2010.
Images
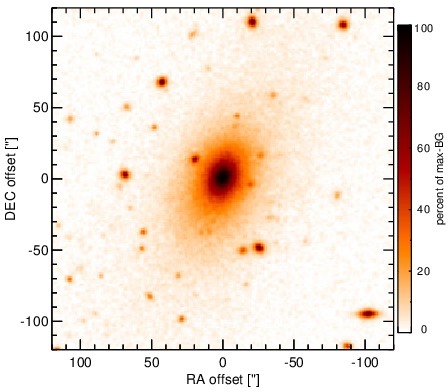
Optical image (DSS, red filter). Displayed are the central 4 arcmin with North being up and East to the left. The colour scaling is linear with white corresponding to the median background (BG) and black to the 0.01% pixels with the highest intensity.
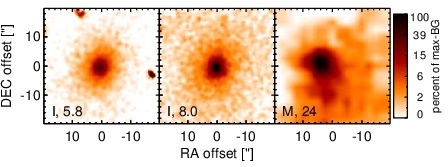
Spitzer MIR images. Displayed are the inner 40 arcsec with North being up and East to the left. The colour scaling is logarithmic with white corresponding to median BG and black to the 0.1% pixels with the highest intensity. The label in the bottom left states instrument and central wavelength of the filter in micron (I: IRAC, M: MIPS).
SEDs
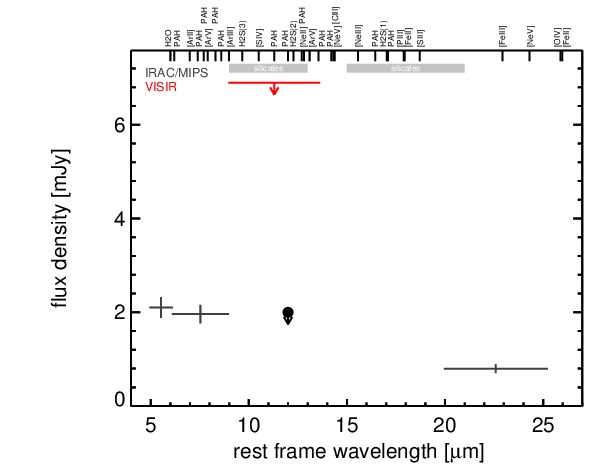
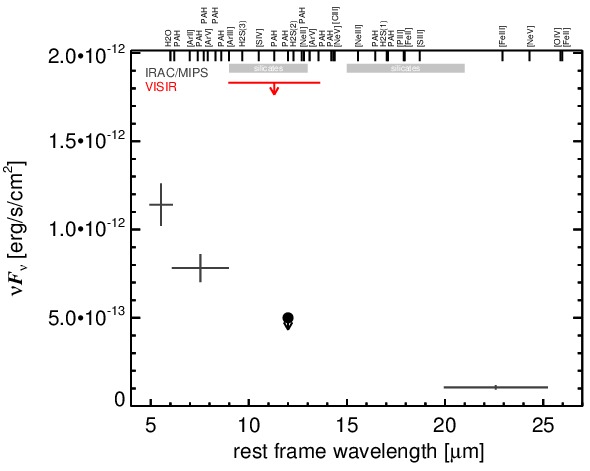
MIR SED. The description of the symbols in all the SED plots (where present) is the following: Grey crosses and solid lines mark the Spitzer/IRAC, MIPS and IRS data. The colour coding of the other symbols is as follows: green for COMICS, magenta for Michelle, blue for T-ReCS and red for VISIR data. Darker-coloured solid lines mark spectra of the corresponding instrument. The black filled circles mark the nuclear 12 and 18 micron continuum emission estimate from the data (where present). The ticks on the top axis mark positions of common MIR emission lines, while the light grey horizontal bars mark wavelength ranges affected by the silicate 10 and 18 micron features.