Sasmirala Individual Information for Pictor A
Description
Pictor A is a radio-loud inclined lenticular galaxy at a redshift of z = 0.0351 (D ~ 161 Mpc) with an FR II radio morphology. It contains an AGN optically classified as a borderline Sy 1.5/LINER [veron-cetty_catalogue_1998, tueller_swift_2008] that belongs to the nine-month BAT AGN sample. Pictor A features two well-studied giant radio lobes extending ~ 0.5 Mpc from the nucleus. A narrow jet extends to the western lobe and is also visible in X-rays (PA~ 281∘; e.g.[perley_radio_1997, wilson_chandra_2001]). The nucleus itself is a compact flat-spectrum radio source. The [O III] emission is extended along the north-west direction by ~ 0.3arcsec ~ 200 pc [simkin_pictor_1999]. After its first MIR detection in IRAS, Pictor A was followed up with Spitzer/IRAC, IRS and MIPS. The corresponding IRAC and MIPS images are dominated by a compact nucleus without any significant non-nuclear emission. Our nuclear MIPS 24 μm photometry is consistent with [shi_far-infrared_2005]. The IRS LR staring-mode spectrum exhibits strong silicate 10 and 18 μm emission and a flat spectral slope in νFν-space. No PAH features are detected (see also [shi_9.7_2006]). Thus, the arcsecond-scale MIR SED is dominated by AGN-heated dust emission. Pictor A was observed with VISIR in the broad SIC filter in 2006 [van_der_wolk_dust_2010], in three narrow N-band filters in 2009 (this work), and with T-ReCS in two N-band and one Q-band filters in 2007 and 2008 (unpublished, to our knowledge). The nucleus appears unresolved in the sharpest images (SIC and Si2), while it appears extended in the longest wavelength filters, NEII and Q2 (FWHM(major axis) ~ 1arcsec ~ 0.7 kpc; PA~ 125∘). The elongation has a low significance owing to the low S/N of the NEII and Q2 images, but corresponds roughly to the [O III] morphology. Deeper imaging is, therefore, required to confirm extension, and we classify the nuclear MIR extension at subarcsecond resolution as uncertain for now. The nuclear photometry is 25% higher than the value by [van_der_wolk_dust_2010] for unknown reasons, and consistent with the Spitzer spectrophotometry. Therefore, the silicate emission originates in the projected central ~ 0.3 kpc of Pictor A, and we use the IRS spectrum to correct our nuclear 12 μm continuum emission estimate for this feature.
- [perley_radio_1997] Richard A. Perley, Hermann-Josef Roser, and Klaus Meisenheimer. The radio galaxy PictorA – a study with the VLA . A&A , 328 pp. 12–32, December 1997.
- [shi_9.7_2006] Y. Shi, G. H. Rieke, D. C. Hines, V. Gorjian, M. W. Werner, K. Cleary, F. J. Low, P. S. Smith, and J. Bouwman. 9.7 μm silicate features in active galactic nuclei: New insights into unification models . ApJ , 653 pp. 127–136, December 2006.
- [shi_far-infrared_2005] Y. Shi, G. H. Rieke, D. C. Hines, G. Neugebauer, M. Blaylock, J. Rigby, E. Egami, K. D. Gordon, and A. Alonso-Herrero. Far-infrared observations of radio quasars and FR II radio galaxies . ApJ , 629 pp. 88–99, August 2005.
- [simkin_pictor_1999] S. M. Simkin, E. M. Sadler, R. Sault, S. J. Tingay, and J. Callcut. Pictor a (PKS 0518-45): From nucleus to lobes . ApJS , 123 pp. 447–465, August 1999.
- [tueller_swift_2008] J. Tueller, R. F. Mushotzky, S. Barthelmy, J. K. Cannizzo, N. Gehrels, C. B. Markwardt, G. K. Skinner, and L. M. Winter. Swift BAT survey of AGNs . ApJ , 681 pp. 113–127, July 2008.
- [van_der_wolk_dust_2010] G. van der Wolk, P. D. Barthel, R. F. Peletier, and J. W. Pel. Dust tori in radio galaxies . A&A , 511 pp. 64, February 2010.
- [veron-cetty_catalogue_1998] M.-P. Veron-Cetty and P. Veron. A Catalogue of quasars and active nuclei . Number 18 in ESO Scientific Report Series. ESO, 8th edition, 1998.
- [wilson_chandra_2001] A. S. Wilson, A. J. Young, and P. L. Shopbell. Chandra x-ray observations of pictor a: High-energy cosmic rays in a radio galaxy . ApJ , 547 pp. 740–753, February 2001.
Images
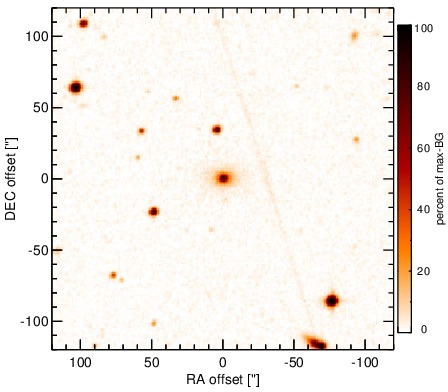
Optical image (DSS, red filter). Displayed are the central 4 arcmin with North being up and East to the left. The colour scaling is linear with white corresponding to the median background (BG) and black to the 0.01% pixels with the highest intensity.
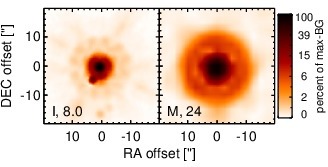
Spitzer MIR images. Displayed are the inner 40 arcsec with North being up and East to the left. The colour scaling is logarithmic with white corresponding to median BG and black to the 0.1% pixels with the highest intensity. The label in the bottom left states instrument and central wavelength of the filter in micron (I: IRAC, M: MIPS).
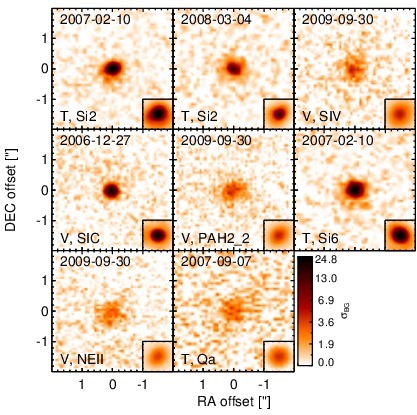
Subarcsecond-resolution MIR images sorted by increasing filter central wavelength. Displayed are the inner 4 arcsec with North being up and East to the left. The colour scaling is logarithmic with white corresponding to median BG and black to the 75% of the highest intensity of all images in units of sig_bg. The inset image (where present; either bottom or top right) shows the central arcsecond of the PSF from the calibrator star, scaled to match the science target. The labels in the bottom left state instrument and filter names (C: COMICS, M: Michelle, T: T-ReCS, V: VISIR).
SEDs
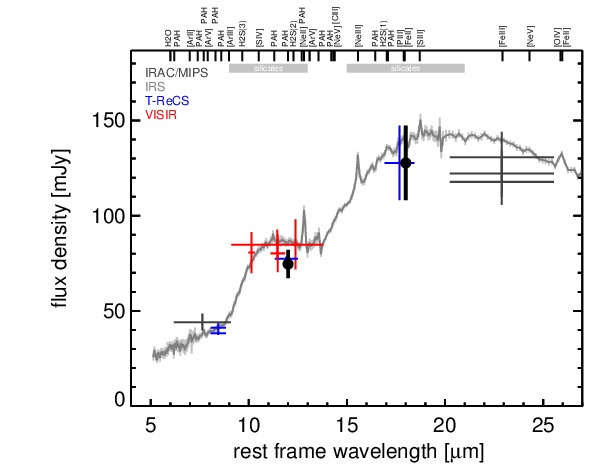
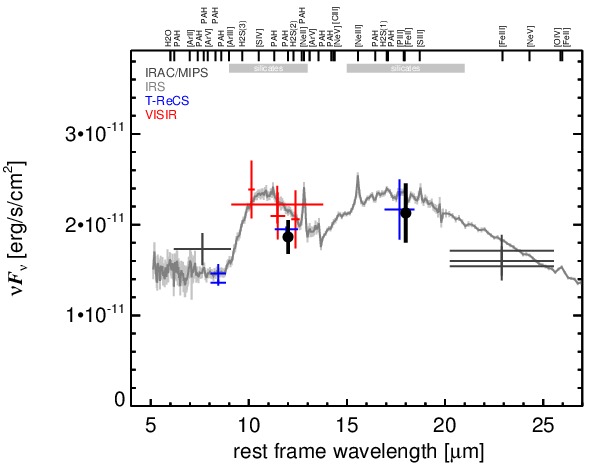
MIR SED. The description of the symbols in all the SED plots (where present) is the following: Grey crosses and solid lines mark the Spitzer/IRAC, MIPS and IRS data. The colour coding of the other symbols is as follows: green for COMICS, magenta for Michelle, blue for T-ReCS and red for VISIR data. Darker-coloured solid lines mark spectra of the corresponding instrument. The black filled circles mark the nuclear 12 and 18 micron continuum emission estimate from the data (where present). The ticks on the top axis mark positions of common MIR emission lines, while the light grey horizontal bars mark wavelength ranges affected by the silicate 10 and 18 micron features.