Sasmirala Individual Information for Superantennae S
Description
The Superantennae is a ultra-luminous infrared system of a pair of merging galaxies at a redshift of z = 0.0617 (D ~ 287 Mpc) with a nuclear separation of ~ 8arcsec ~ 10 kpc in the north-south direction (PA~-10∘; [melnick_ntt_1990]). The southern component, Superantennae S (AM 1925-724 NED02), contains a Sy 2 nucleus [veron-cetty_catalogue_2010], while the northern exhibits apparently pure star formation [mirabel_superantennae_1991, colina_massive_1991, vanzi_multi-wavelength_2002, berta_spatially-resolved_2003]. After first being detected in the MIR with IRAS, the Superantennae were followed up with ground-based N-band photometry [mirabel_superantennae_1991] and space-based MIR observations with ISO [rigopoulou_large_1999, lutz_mid-infrared_1999, tran_isocam-cvf_2001, klaas_infrared_2001, charmandaris_mid-infrared_2002] and Spitzer/IRAC, IRS and MIPS. The corresponding IRAC and MIPS images show a compact southern nucleus dominating the MIR emission completely, while the northern nucleus is only faintly detected as a compact source. No significant extended emission is visible. The IRS LR staring-mode spectrum of Superantennae S exhibits silicate 10 μm absorption, significant PAH emission, and a steep red spectral slope in νFν-space (see also [wu_spitzer/irs_2009]). Thus, the arcsecond-scale MIR SED appears to be significantly affected by star formation. The Superantennae were imaged with T-ReCS in the broad N filter in 2004 (unpublished, to our knowledge) and with the broad Qa filter in 2008 and 2009 [imanishi_subaru_2011]. In both cases, the southern nucleus was detected as a compact source, while the northern nucleus is faintly detected only in the N image as a compact source (flux: 6 ± 1 mJy; FWHM(major axis)~ 0,47arcsec; PA~-18∘). The southern nucleus appears marginally resolved in the sharpest image (N; FWHM~ 0.46arcsec ~ 0.6 kpc) but not in the Qa images. Therefore, at least a second epoch of subarcsecond-resolution N-band imaging is required to verify whether Superantennae S is truly extended in the N-band at subarcsecond resolution. Our nuclear photometry is consistent with [imanishi_subaru_2011] and the Spitzer spectrophotometry. Therefore, we use the latter to compute the nuclear 12 μm continuum emission estimate, which however is presumably still star-formation contaminated.
- [berta_spatially-resolved_2003] S. Berta, J. Fritz, A. Franceschini, A. Bressan, and C. Pernechele. Spatially-resolved spectrophotometric analysis and modelling of the superantennae . A&A , 403 pp. 119–134, May 2003.
- [charmandaris_mid-infrared_2002] V. Charmandaris, O. Laurent, E. Le Floc'h, I. F. Mirabel, M. Sauvage, S. C. Madden, P. Gallais, L. Vigroux, and C. J. Cesarsky. Mid-infrared observations of the ultraluminous galaxies IRAS 14348-1447, IRAS 19254-7245, and IRAS 23128-5919 . A&A , 391 pp. 429–440, August 2002.
- [colina_massive_1991] Luis Colina, Sebastian Lipari, and F. Macchetto. Massive star formation and superwinds in IRAS 19254 - 7245 (the 'Superantennae') . ApJ , 379 pp. 113–121, September 1991.
- [imanishi_subaru_2011] Masatoshi Imanishi, Keisuke Imase, Nagisa Oi, and Kohei Ichikawa. Subaru and gemini high spatial resolution infrared 18 μm imaging observations of nearby luminous infrared galaxies . AJ , 141 pp. 156, May 2011.
- [klaas_infrared_2001] U. Klaas, M. Haas, S. A. H. Müller, R. Chini, B. Schulz, I. Coulson, H. Hippelein, K. Wilke, M. Albrecht, and D. Lemke. Infrared to millimetre photometry of ultra-luminous IR galaxies: New evidence favouring a 3-stage dust model . A&A , 379 pp. 823–844, December 2001.
- [lutz_mid-infrared_1999] D. Lutz, S. Veilleux, and R. Genzel. Mid-infrared and optical spectroscopy of ultraluminous infrared galaxies: A comparison . ApJL , 517 pp. L13–L17, May 1999.
- [melnick_ntt_1990] J. Melnick and I. F. Mirabel. NTT images of ultraluminous infrared galaxies . A&A , 231 pp. L19–L22, May 1990.
- [mirabel_superantennae_1991] I. F. Mirabel, D. Lutz, and J. Maza. The superantennae . A&A , 243 pp. 367–372, March 1991.
- [rigopoulou_large_1999] D. Rigopoulou, H. W. W. Spoon, R. Genzel, D. Lutz, A. F. M. Moorwood, and Q. D. Tran. A large mid-infrared spectroscopic and near-infrared imaging survey of ultraluminous infrared galaxies: Their nature and evolution . AJ , 118 pp. 2625–2645, December 1999.
- [tran_isocam-cvf_2001] Q. D. Tran, D. Lutz, R. Genzel, D. Rigopoulou, H. W. W. Spoon, E. Sturm, M. Gerin, D. C. Hines, A. F. M. Moorwood, D. B. Sanders, N. Scoville, Y. Taniguchi, and M. Ward. Isocam-cvf 5-12 micron spectroscopy of ultraluminous infrared galaxies . ApJ , 552 pp. 527–543, May 2001.
- [vanzi_multi-wavelength_2002] L. Vanzi, S. Bagnulo, E. Le Floc'h, R. Maiolino, E. Pompei, and W. Walsh. Multi-wavelength study of IRAS 19254-7245 - the superantennae . A&A , 386 pp. 464–471, May 2002.
- [veron-cetty_catalogue_2010] M.-P. Véron-Cetty and P. Véron. A catalogue of quasars and active nuclei: 13th edition . A&A , 518 pp. 10, July 2010.
- [wu_spitzer/irs_2009] Yanling Wu, Vassilis Charmandaris, Jiasheng Huang, Luigi Spinoglio, and Silvia Tommasin. Spitzer/IRS 5-35 μm low-resolution spectroscopy of the 12 μm seyfert sample . ApJ , 701 pp. 658–676, August 2009.
Images
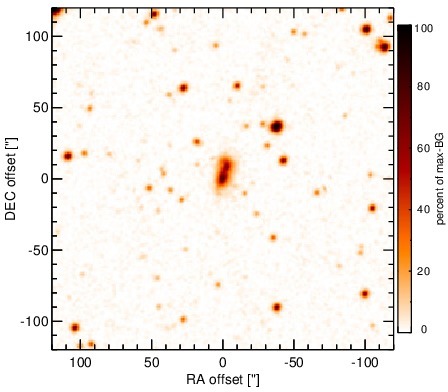
Optical image (DSS, red filter). Displayed are the central 4 arcmin with North being up and East to the left. The colour scaling is linear with white corresponding to the median background (BG) and black to the 0.01% pixels with the highest intensity.
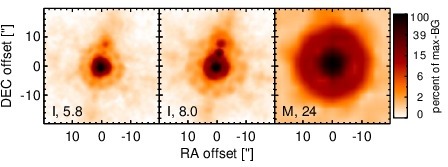
Spitzer MIR images. Displayed are the inner 40 arcsec with North being up and East to the left. The colour scaling is logarithmic with white corresponding to median BG and black to the 0.1% pixels with the highest intensity. The label in the bottom left states instrument and central wavelength of the filter in micron (I: IRAC, M: MIPS).
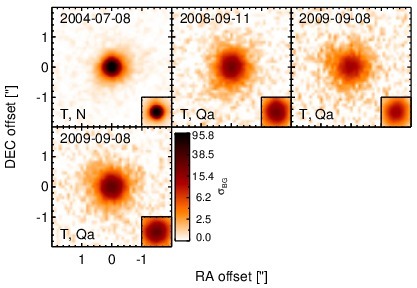
Subarcsecond-resolution MIR images sorted by increasing filter central wavelength. Displayed are the inner 4 arcsec with North being up and East to the left. The colour scaling is logarithmic with white corresponding to median BG and black to the 75% of the highest intensity of all images in units of sig_bg. The inset image (where present; either bottom or top right) shows the central arcsecond of the PSF from the calibrator star, scaled to match the science target. The labels in the bottom left state instrument and filter names (C: COMICS, M: Michelle, T: T-ReCS, V: VISIR).
SEDs
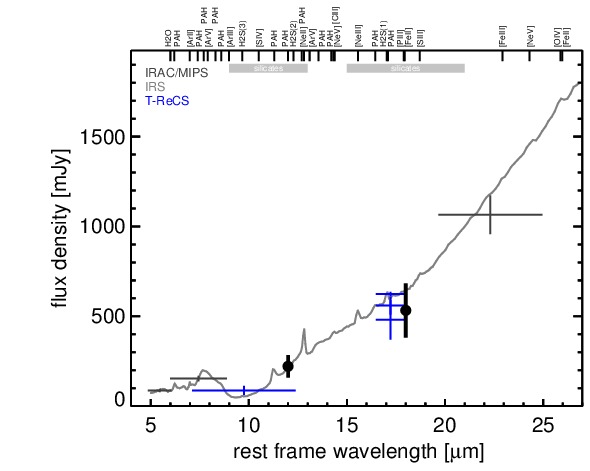
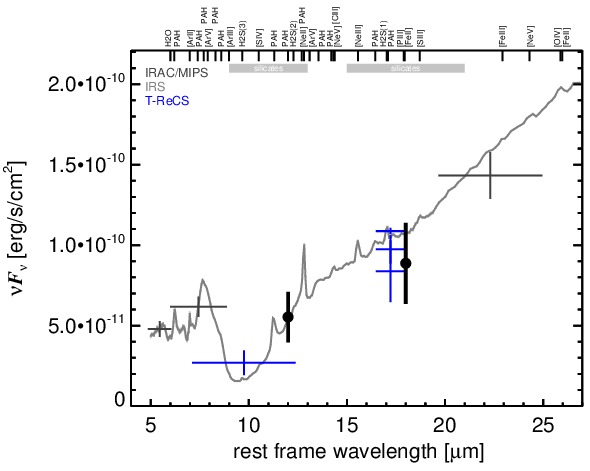
MIR SED. The description of the symbols in all the SED plots (where present) is the following: Grey crosses and solid lines mark the Spitzer/IRAC, MIPS and IRS data. The colour coding of the other symbols is as follows: green for COMICS, magenta for Michelle, blue for T-ReCS and red for VISIR data. Darker-coloured solid lines mark spectra of the corresponding instrument. The black filled circles mark the nuclear 12 and 18 micron continuum emission estimate from the data (where present). The ticks on the top axis mark positions of common MIR emission lines, while the light grey horizontal bars mark wavelength ranges affected by the silicate 10 and 18 micron features.