Sasmirala Individual Information for UGC 12348
Description
UGC 12348 is a highly-inclined spiral galaxy at a redshift of z = 0.0255 (D ~ 110 Mpc) with a Sy 2 nucleus [veron-cetty_catalogue_2010]. It features an unresolved radio nucleus [schmitt_jet_2001] and east-west elongated, extended [O III] emission (diameter~ 2.2arcsec ~ 1.1 kpc; PA~ 100∘; [schmitt_hubble_2003]). UGC 12348 was detected with IRAS but has not been followed up with ISO or Spitzer. The WISE images show a bright nucleus embedded in disc-like host emission. Furthermore, this object was imaged with T-ReCS in the Qa filter in 2007 (unpublished, to our knowledge), and a possibly east-west elongated nucleus without further host emission was detected (FWHM(major axis)~ 0.61arcsec ~ 310 pc; PA~ 70∘). However, at least another epoch of subarcsecond MIR imaging is required to confirm this extension.
- [schmitt_hubble_2003] H. R. Schmitt, J. L. Donley, R. R. J. Antonucci, J. B. Hutchings, and A. L. Kinney. A hubble space telescope survey of extended [o III] λ5007 emission in a far-infrared selected sample of seyfert galaxies: Observations . ApJS , 148 pp. 327–352, October 2003.
- [schmitt_jet_2001] H. R. Schmitt, J. S. Ulvestad, R. R. J. Antonucci, and A. L. Kinney. Jet directions in seyfert galaxies: Radio continuum imaging data . ApJS , 132 pp. 199–209, February 2001.
- [veron-cetty_catalogue_2010] M.-P. Véron-Cetty and P. Véron. A catalogue of quasars and active nuclei: 13th edition . A&A , 518 pp. 10, July 2010.
Images
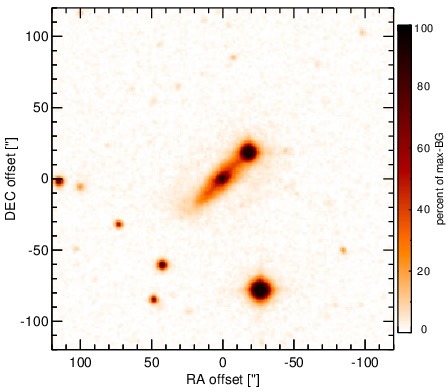
Optical image (DSS, red filter). Displayed are the central 4 arcmin with North being up and East to the left. The colour scaling is linear with white corresponding to the median background (BG) and black to the 0.01% pixels with the highest intensity.
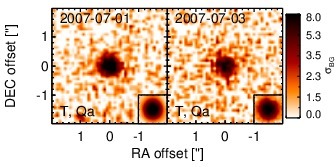
Subarcsecond-resolution MIR images sorted by increasing filter central wavelength. Displayed are the inner 4 arcsec with North being up and East to the left. The colour scaling is logarithmic with white corresponding to median BG and black to the 75% of the highest intensity of all images in units of sig_bg. The inset image (where present; either bottom or top right) shows the central arcsecond of the PSF from the calibrator star, scaled to match the science target. The labels in the bottom left state instrument and filter names (C: COMICS, M: Michelle, T: T-ReCS, V: VISIR).
SEDs
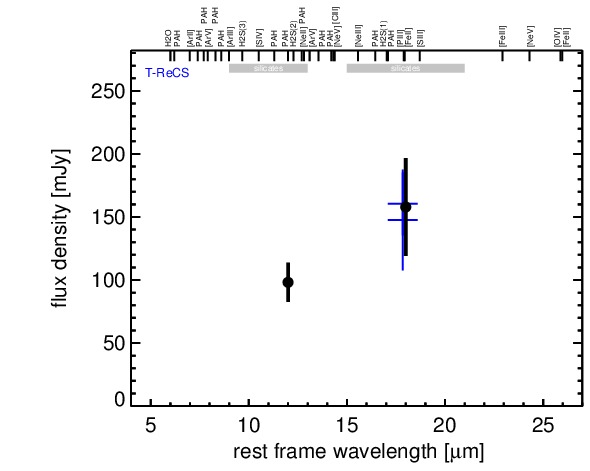
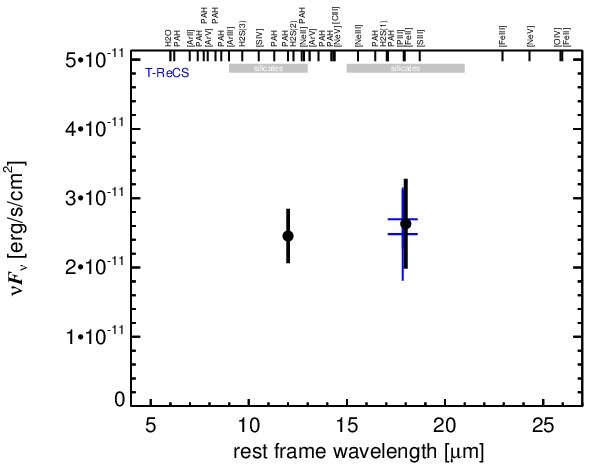
MIR SED. The description of the symbols in all the SED plots (where present) is the following: Grey crosses and solid lines mark the Spitzer/IRAC, MIPS and IRS data. The colour coding of the other symbols is as follows: green for COMICS, magenta for Michelle, blue for T-ReCS and red for VISIR data. Darker-coloured solid lines mark spectra of the corresponding instrument. The black filled circles mark the nuclear 12 and 18 micron continuum emission estimate from the data (where present). The ticks on the top axis mark positions of common MIR emission lines, while the light grey horizontal bars mark wavelength ranges affected by the silicate 10 and 18 micron features.