Sasmirala Individual Information for UGC 5101
Description
UGC 5101 is an infrared-ultra-luminous disturbed highly-inclined spiral galaxy [sanders_ultraluminous_1988] at a redshift of z = 0.0394 (D ~ 182 Mpc) with an active nucleus containing both a starburst and an AGN. This lead to various optical classifications in the literature ranging from Sy 1 to Sy 2 or LINER, while we follow [goncalves_agns_1999] and treat the nucleus as AGN/starburst composite. The L-band and X-ray properties provide evidence for a highly obscured AGN in UGC 5101 [imanishi_strong_2001, imanishi_x-ray_2003]. A compact core with elliptical extended emission ~ 2arcsec ~ 1.6 kpc in the east-west direction was detected in subarcsecond-resolution radio observations (PA~ 90∘; [condon_compact_1991, crawford_vla_1996]). Furthermore OH mega-maser emission was detected in UGC 5101 [martin_discovery_1989]. After first being detected in the MIR with IRAS, UGC 5101 was followed up with ground-based MIR observations [carico_iras_1988, sanders_ultraluminous_1988, maiolino_new_1995, gorjian_10_2004]. The first subarcsecond-resolution MIR images were presented by [soifer_high_2000] obtained with Keck/LWS and MIRLIN in 1998, and show a compact nucleus embedded within elliptical ~ 2arcsec ~ 1.6 kpc extended emission along PA~ 80∘. This is cospatial with the radio extension. UGC 5101 was also observed in the MIR from space with ISO [rigopoulou_large_1999, lutz_mid-infrared_1999, klaas_infrared_2001, tran_isocam-cvf_2001, spoon_ice_2002] and Spitzer/IRAC, IRS and MIPS. The corresponding IRAC 5.8 and 8.0 μm images show an elongated nucleus in the same direction (FWHM(major axis)~ 4arcsec ~ 3.3 kpc; PA~ 80∘), while the nucleus is nearly unresolved in the MIPS 24 μm image. The IRS LR staring-mode spectrum exhibits deep silicate 10 and 18 μm absorption, strong PAH emission, and a steep red spectral slope in in νFν-space (see also [armus_observations_2004, armus_observations_2007, dartois_carbonaceous_2007, farrah_high-resolution_2007, wu_spitzer/irs_2009]). Thus, the arcsecond-scale MIR SED indicates both a buried AGN and intense star formation. UGC 5101 was observed with COMICS in the N8.8 and Q17.7 filters in 2009 (unpublished, to our knowledge), and a compact nucleus was weakly detected in both cases. The nucleus appears to be similarly elongated in N8.8 image as in the earlier Keck images of [soifer_high_2000]. Therefore, we classify the nucleus of UGC 5101 as extended in the MIR at subarcsecond resolution. The nuclear MIR photometry is on average ~ 15% lower than the Spitzer spectrophotometry. However, it is likely that the former is still significantly affected by star formation.
- [armus_observations_2004] L. Armus, V. Charmandaris, H. W. W. Spoon, J. R. Houck, B. T. Soifer, B. R. Brandl, P. N. Appleton, H. I. Teplitz, S. J. U. Higdon, D. W. Weedman, D. Devost, P. W. Morris, K. I. Uchida, J. van Cleve, D. J. Barry, G. C. Sloan, C. J. Grillmair, M. J. Burgdorf, S. B. Fajardo-Acosta, J. G. Ingalls, J. Higdon, L. Hao, J. Bernard-Salas, T. Herter, J. Troeltzsch, B. Unruh, and M. Winghart. Observations of ultraluminous infrared galaxies with the infrared spectrograph (IRS) on the spitzer space telescope: Early results on markarian 1014, markarian 463, and UGC 5101 . ApJS , 154 pp. 178–183, September 2004.
- [armus_observations_2007] L. Armus, V. Charmandaris, J. Bernard-Salas, H. W. W. Spoon, J. A. Marshall, S. J. U. Higdon, V. Desai, H. I. Teplitz, L. Hao, D. Devost, B. R. Brandl, Y. Wu, G. C. Sloan, B. T. Soifer, J. R. Houck, and T. L. Herter. Observations of ultraluminous infrared galaxies with the infrared spectrograph on the spitzer space telescope. II. the IRAS bright galaxy sample . ApJ , 656 pp. 148–167, February 2007.
- [carico_iras_1988] David P. Carico, D. B. Sanders, B. T. Soifer, J. H. Elias, K. Matthews, and G. Neugebauer. The IRAS bright galaxy sample. III - 1-10 micron observations and coadded IRAS data for galaxies with l(IR) equal to or greater than 10 to the 11th solar luminosities . AJ , 95 pp. 356–373, February 1988.
- [condon_compact_1991] J. J. Condon, Z.-P. Huang, Q. F. Yin, and T. X. Thuan. Compact starbursts in ultraluminous infrared galaxies . ApJ , 378 pp. 65–76, September 1991.
- [crawford_vla_1996] Thomas Crawford, Jonathan Marr, Bruce Partridge, and Michael A. Strauss. VLA observations of ultraluminous IRAS galaxies: Active nuclei or starbursts? . ApJ , 460 pp. 225, March 1996.
- [dartois_carbonaceous_2007] E. Dartois and G. M. Muñoz-Caro. Carbonaceous dust grains in luminous infrared galaxies. Spitzer/IRS reveals a-C:H as an abundant and ubiquitous ISM component . A&A , 476 pp. 1235–1242, December 2007.
- [farrah_high-resolution_2007] D. Farrah, J. Bernard-Salas, H. W. W. Spoon, B. T. Soifer, L. Armus, B. Brandl, V. Charmandaris, V. Desai, S. Higdon, D. Devost, and J. Houck. High-resolution mid-infrared spectroscopy of ultraluminous infrared galaxies . ApJ , 667 pp. 149–169, September 2007.
- [goncalves_agns_1999] A. C. Gonçalves, M.-P. Véron-Cetty, and P. Véron. AGNs with composite spectra. II. additional data . A&AS , 135 pp. 437–466, March 1999.
- [gorjian_10_2004] V. Gorjian, M. W. Werner, T. H. Jarrett, D. M. Cole, and M. E. Ressler. 10 micron imaging of seyfert galaxies from the 12 micron sample . ApJ , 605 pp. 156–167, April 2004.
- [imanishi_strong_2001] Masatoshi Imanishi, C. C. Dudley, and Philip R. Maloney. Strong evidence for a buried active galactic nucleus in UGC 5101: Implications for LINER-type ultraluminous infrared galaxies . ApJL , 558 pp. L93–L96, September 2001.
- [imanishi_x-ray_2003] Masatoshi Imanishi, Yuichi Terashima, Naohisa Anabuki, and Takao Nakagawa. X-ray evidence of a buried active galactic nucleus in UGC 5101 . ApJL , 596 pp. L167–L170, October 2003.
- [klaas_infrared_2001] U. Klaas, M. Haas, S. A. H. Müller, R. Chini, B. Schulz, I. Coulson, H. Hippelein, K. Wilke, M. Albrecht, and D. Lemke. Infrared to millimetre photometry of ultra-luminous IR galaxies: New evidence favouring a 3-stage dust model . A&A , 379 pp. 823–844, December 2001.
- [lutz_mid-infrared_1999] D. Lutz, S. Veilleux, and R. Genzel. Mid-infrared and optical spectroscopy of ultraluminous infrared galaxies: A comparison . ApJL , 517 pp. L13–L17, May 1999.
- [maiolino_new_1995] R. Maiolino, M. Ruiz, G. H. Rieke, and L. D. Keller. New constraints on the unified model of seyfert galaxies . ApJ , 446 pp. 561, June 1995.
- [martin_discovery_1989] Jean-Michel Martin, Lucette Bottinelli, Lucienne Gouguenheim, Anne-Marie Le Squeren, and Michel Dennefeld. Discovery of nine new extragalactic OH megamasers - the role and efficiency of far-infrared radiation . Academie des Sciences Paris Comptes Rendus Serie Sciences Mathematiques , 308 pp. 287–292, January 1989.
- [rigopoulou_large_1999] D. Rigopoulou, H. W. W. Spoon, R. Genzel, D. Lutz, A. F. M. Moorwood, and Q. D. Tran. A large mid-infrared spectroscopic and near-infrared imaging survey of ultraluminous infrared galaxies: Their nature and evolution . AJ , 118 pp. 2625–2645, December 1999.
- [sanders_ultraluminous_1988] D. B. Sanders, B. T. Soifer, J. H. Elias, B. F. Madore, K. Matthews, G. Neugebauer, and N. Z. Scoville. Ultraluminous infrared galaxies and the origin of quasars . ApJ , 325 pp. 74–91, February 1988.
- [soifer_high_2000] B. T. Soifer, G. Neugebauer, K. Matthews, E. Egami, E. E. Becklin, A. J. Weinberger, M. Ressler, M. W. Werner, A. S. Evans, N. Z. Scoville, J. A. Surace, and J. J. Condon. High resolution mid-infrared imaging of ultraluminous infrared galaxies . AJ , 119 pp. 509–523, February 2000.
- [spoon_ice_2002] H. W. W. Spoon, J. V. Keane, A. G. G. M. Tielens, D. Lutz, A. F. M. Moorwood, and O. Laurent. Ice features in the mid-IR spectra of galactic nuclei . A&A , 385 pp. 1022–1041, April 2002.
- [tran_isocam-cvf_2001] Q. D. Tran, D. Lutz, R. Genzel, D. Rigopoulou, H. W. W. Spoon, E. Sturm, M. Gerin, D. C. Hines, A. F. M. Moorwood, D. B. Sanders, N. Scoville, Y. Taniguchi, and M. Ward. Isocam-cvf 5-12 micron spectroscopy of ultraluminous infrared galaxies . ApJ , 552 pp. 527–543, May 2001.
- [wu_spitzer/irs_2009] Yanling Wu, Vassilis Charmandaris, Jiasheng Huang, Luigi Spinoglio, and Silvia Tommasin. Spitzer/IRS 5-35 μm low-resolution spectroscopy of the 12 μm seyfert sample . ApJ , 701 pp. 658–676, August 2009.
Images
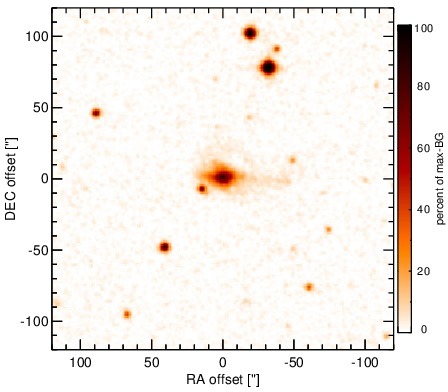
Optical image (DSS, red filter). Displayed are the central 4 arcmin with North being up and East to the left. The colour scaling is linear with white corresponding to the median background (BG) and black to the 0.01% pixels with the highest intensity.
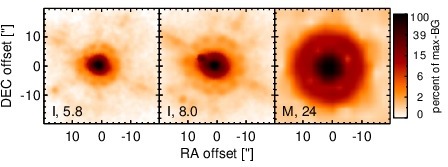
Spitzer MIR images. Displayed are the inner 40 arcsec with North being up and East to the left. The colour scaling is logarithmic with white corresponding to median BG and black to the 0.1% pixels with the highest intensity. The label in the bottom left states instrument and central wavelength of the filter in micron (I: IRAC, M: MIPS).
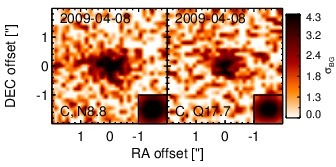
Subarcsecond-resolution MIR images sorted by increasing filter central wavelength. Displayed are the inner 4 arcsec with North being up and East to the left. The colour scaling is logarithmic with white corresponding to median BG and black to the 75% of the highest intensity of all images in units of sig_bg. The inset image (where present; either bottom or top right) shows the central arcsecond of the PSF from the calibrator star, scaled to match the science target. The labels in the bottom left state instrument and filter names (C: COMICS, M: Michelle, T: T-ReCS, V: VISIR).
SEDs
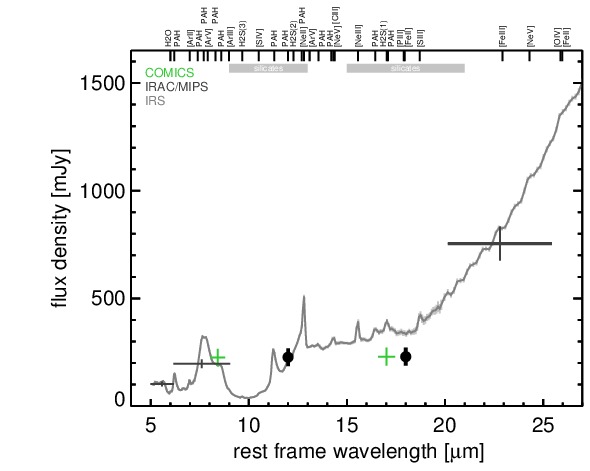
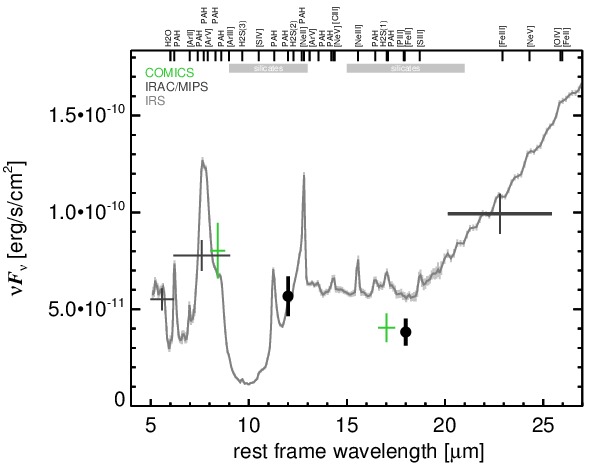
MIR SED. The description of the symbols in all the SED plots (where present) is the following: Grey crosses and solid lines mark the Spitzer/IRAC, MIPS and IRS data. The colour coding of the other symbols is as follows: green for COMICS, magenta for Michelle, blue for T-ReCS and red for VISIR data. Darker-coloured solid lines mark spectra of the corresponding instrument. The black filled circles mark the nuclear 12 and 18 micron continuum emission estimate from the data (where present). The ticks on the top axis mark positions of common MIR emission lines, while the light grey horizontal bars mark wavelength ranges affected by the silicate 10 and 18 micron features.