Sasmirala Individual Information for Z 41-20
Description
Z 41-20 is a galaxy at low-inclination at a redshift of z = 0.0360 (D ~ 170 Mpc) with a little-studied Sy 2 nucleus [veron-cetty_catalogue_2010], discovered with Swift/BAT in X-rays [landi_agn_2007]. It belongs to the nine-month BAT AGN sample. This object remained undetected in the MIR with IRAS and appears as a compact source in the WISE images. A Spitzer/IRS LR staring-mode spectrum is available [sargsyan_infrared_2011] and exhibits silicate 10 μm absorption, strong PAH features, and a red spectral slope in νFν-space. Thus, the arcsecond-scale MIR SED indicates significant star formation in Z 41-20. We imaged this object with VISIR in three narrow N-band filters in 2009 and weakly detected a compact nucleus. The low S/N of the detection does not allow for a quantitative extension analysis. The nuclear VISIR is on average ~ 50% lower than the IRS spectrum. Therefore, the total MIR emission of Z 41-20 is indeed star formation dominated. The nuclear MIR SED indicates much weaker PAH 11.3 μm emission in the central ~ 0.3 kpc.
- [landi_agn_2007] R. Landi, N. Masetti, L. Morelli, E. Palazzi, L. Bassani, A. Malizia, A. Bazzano, A. J. Bird, A. J. Dean, G. Galaz, D. Minniti, and P. Ubertini. The AGN nature of 11 out of 12 Swift/RXTE unidentified sources through optical and x-ray spectroscopy . ApJ , 669 pp. 109–125, November 2007.
- [sargsyan_infrared_2011] Lusine Sargsyan, Daniel Weedman, Vianney Lebouteiller, James Houck, Donald Barry, Ashot Hovhannisyan, and Areg Mickaelian. Infrared spectra and spectral energy distributions for dusty starbursts and active galactic nuclei . ApJ , 730 pp. 19, March 2011.
- [veron-cetty_catalogue_2010] M.-P. Véron-Cetty and P. Véron. A catalogue of quasars and active nuclei: 13th edition . A&A , 518 pp. 10, July 2010.
Images
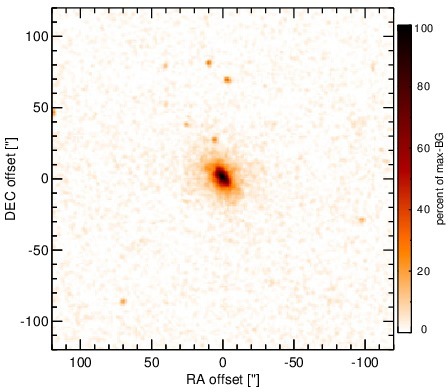
Optical image (DSS, red filter). Displayed are the central 4 arcmin with North being up and East to the left. The colour scaling is linear with white corresponding to the median background (BG) and black to the 0.01% pixels with the highest intensity.
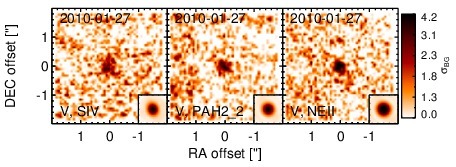
Subarcsecond-resolution MIR images sorted by increasing filter central wavelength. Displayed are the inner 4 arcsec with North being up and East to the left. The colour scaling is logarithmic with white corresponding to median BG and black to the 75% of the highest intensity of all images in units of sig_bg. The inset image (where present; either bottom or top right) shows the central arcsecond of the PSF from the calibrator star, scaled to match the science target. The labels in the bottom left state instrument and filter names (C: COMICS, M: Michelle, T: T-ReCS, V: VISIR).
SEDs
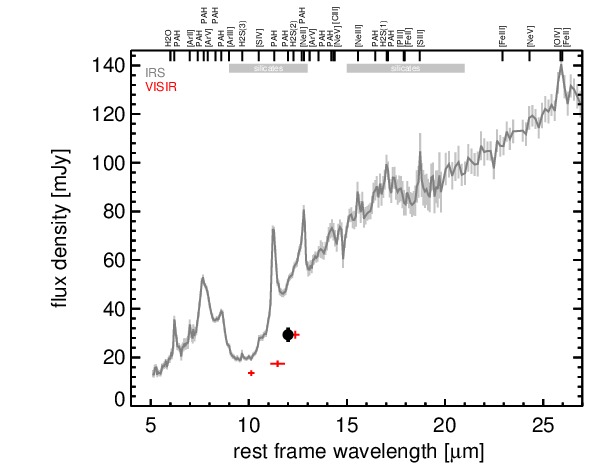
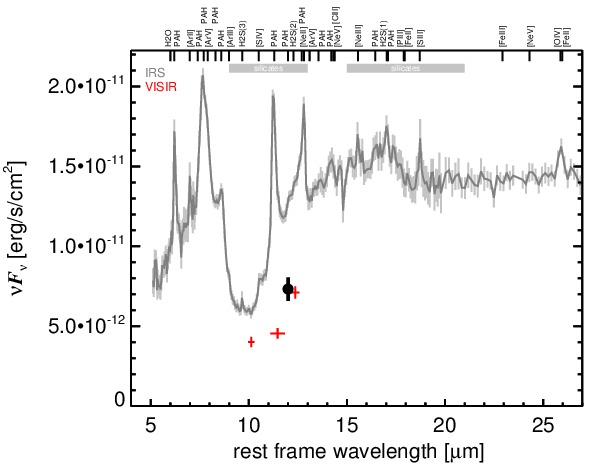
MIR SED. The description of the symbols in all the SED plots (where present) is the following: Grey crosses and solid lines mark the Spitzer/IRAC, MIPS and IRS data. The colour coding of the other symbols is as follows: green for COMICS, magenta for Michelle, blue for T-ReCS and red for VISIR data. Darker-coloured solid lines mark spectra of the corresponding instrument. The black filled circles mark the nuclear 12 and 18 micron continuum emission estimate from the data (where present). The ticks on the top axis mark positions of common MIR emission lines, while the light grey horizontal bars mark wavelength ranges affected by the silicate 10 and 18 micron features.